Tracking San Francisco’s Microclimates with Arduino MKR1000
In April, Arduino launched the new MKR1000 board, a move that I’m sure made countless IoT fanatics, including myself, jump for joy. The MKR1000 integrates the functionalities of the Arduino Uno and a WiFi shield into one neat little two-inch board, making it easier than ever to add all sorts of objects to the “Internet of Things”. With its small size and built-in WiFi capabilities, this little device presents the perfect opportunity for anyone to use PubNub to transmit data from practically anywhere.
To prove that point, I set out creating this demo, in which I’ll walk through how to set up the MKR1000 with PubNub and then use it to transmit temperature data from different locations within San Francisco, a city known for its microclimates. If you follow along, you’ll have access to temperature data from any locations you choose, and you’ll be able to monitor it in real time. To top it all off, I'll show you how to use both the EON Chart Builder and Mapbox Editor to present the data in just a few easy steps. Let's get started!
The full code repository is available on GitHub.
Getting Started with the Arduino MKR1000
Before you can get started working with the MKR, there are a few simple things you need to do to make sure that you have the correct software installed to use this magic little board.
Installing Drivers and Updating Libraries
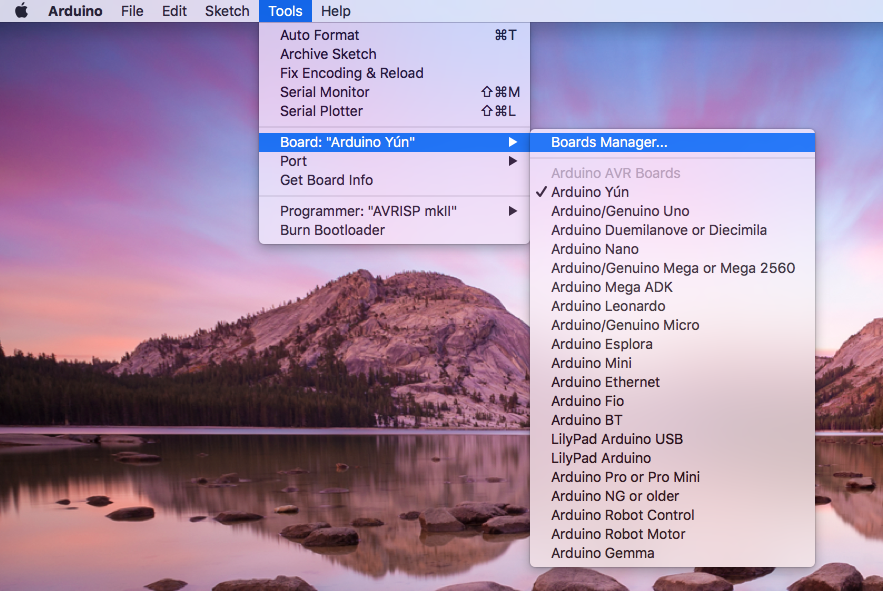
After downloading the latest Arduino IDE, open up the software. To select the right board, go to Tools > Board > Boards Manager. Select the box that says “Arduino SAMD Boards (32-bits ARM Cortex-M0+)” and click Install. Now go back to Tools > Board and you should see the board listed. Click it, and plug in your device with a micro-USB cable. If you’re working on a PC, a box should pop up to install the driver – do it. Mac users can rest easy and ignore this step.
To work with the WiFi capabilities of the MKR1000, as well as collect sensor data, you‘ll need to install both the WiFi101 library and the DHT sensor library, a library which handles all the functions of the DHT22 Temperature Sensor we’re using in this tutorial. Do this by going to Sketch > Include Library > Manage Libraries. Find each library and and click Install to be able to use them in your project.
Lastly, you'll need to install the PubNub library if you haven't done so already, which you can do through the PubNub Arduino documentation page. To make it compatible with the MKR1000, you'll need to tweak a few lines of the library. Open up PubNub.h in any basic text editor, and switch the comments for the ethernet and WiFi lines, as shown below.
//#define PubNub_Ethernet
#define PubNub_WiFi
Also modify the line that includes the WiFi library so that it includes WiFi101 instead.
#elif defined(PubNub_WiFi)
#include <WiFi101.h>
Now that everything's set up, you're ready to start programming your board!
Connecting to WiFi
To connect your board to WiFi, be sure to include the WiFi101 library at the top of your code, then input your network id and password as variables and set your initial WiFi status.
#include <SPI.h>
#include <WiFi101.h>
char ssid[] = "network-id";
char pass[] = "network-password";
int status = WL_IDLE_STATUS;
In the setup portion of your code, you need to establish your WiFi connection. It's best to also print this information to the console to indicate whether or not you were actually successful in connecting.
void setup() {
  Serial.begin(9600);
  while (status != WL_CONNECTED) {
    Serial.print("Attempting to connect to network... ");
    status = WiFi.begin(ssid, pass);
    delay(10000);
  }
  Serial.print("SSID:");
  Serial.println(WiFi.SSID());
}
Open up the console and run this code. If you see your SSID printed on the screen, congratulations! You successfully connected your MKR1000 to WiFi.
Setting Up the Hardware
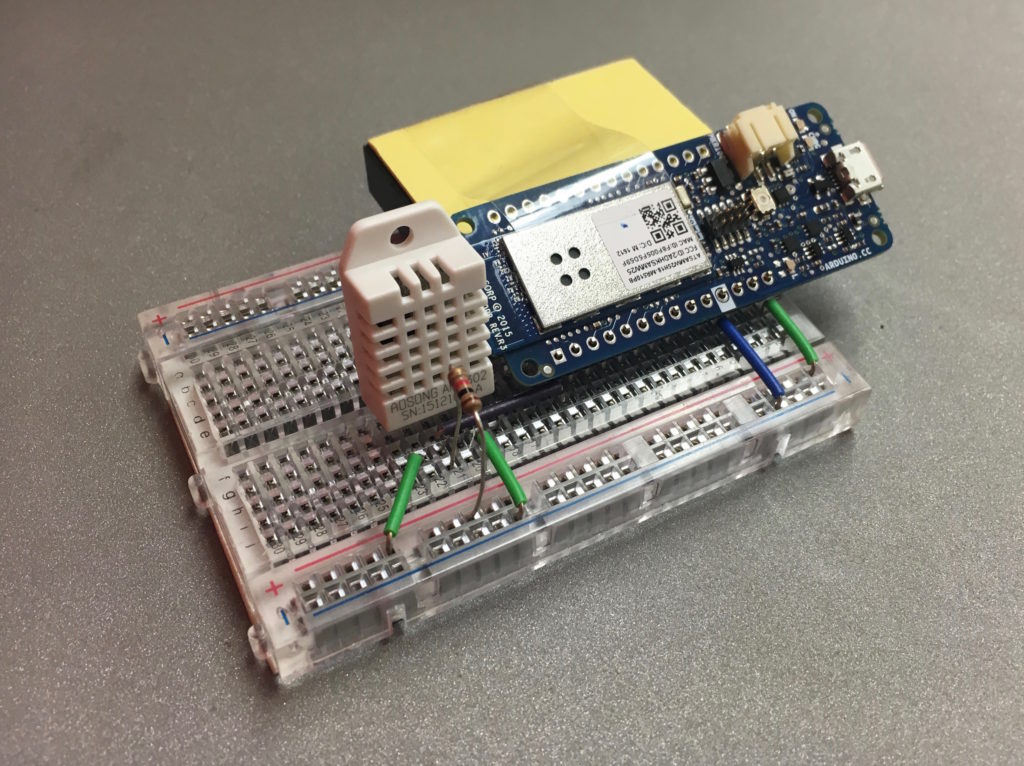
For this project, you're going to build a fairly basic circuit in order to connect your temperature sensor to the Arduino. At the same time, you're going to wire the MKR1000 so that you can run it off battery power, which is necessary in order for it to operate while unplugged from the computer. Keep in mind that connecting the MKR to the breadboard can be a bit tricky, so it might be helpful to place a block under one side of the board so that it stays connected while you're using it.
Hardware You'll Need
- 1 Arduino MKR1000 or Genuino MKR1000
- 1 resistor (10k)
- 5 male/male wires
- 1 breadboard
- 1 DHT22 sensor
- 1 battery holder (4AA)
- 4 AA batteries
Building the DHT22 Circuit
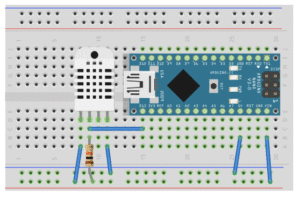
Now that you have all the pieces, let's put them together. First attach the ground and 5v pins on the MKR1000 to the breadboard, then hook up your DHT22 temperature sensor as shown. You should double check that the legs of your sensor are connected to the right places – the left leg should be attached to power, the right leg to ground, and the second leg from the left to a digital Arduino pin (I used pin 6) and to a resistor, which is also connected to power.
Insert the batteries into the holder and connect the black wire to the negative column on your breadboard and the red wire to the VIN pin on the Arduino. Your Arduino should light up to show that it's connected to power, and ta-da! You've got a fully wired circuit. You can unplug the battery for now, you won't need the board to run by itself until after you write the program.
Sending Temperature Data with PubNub
Part of what defines IoT is the fact that it combines everyday pieces of hardware, objects, and activities with software components that connect them to the digital world. This connection is what PubNub specializes in – it provides the software necessary for devices to launch information from the real world into the digital world. Since you’ve already got the hardware all set up, the next steps of this project involve reading the data and using PubNub to publish it. That way, in true IoT fashion, you can access it from anywhere. You’ll need a few libraries for this project, so be sure that all of these are included at the top of your program.
#include <SPI.h>
#include <WiFi101.h>
#include <PubNub.h>
#include <DHT.h>
Reading Data from the DHT22 Sensor
To use the sensor, you first need to initialize it using its pin and type.
#define DHTPIN 6
#define DHTTYPE DHT22
After that, reading the sensor data only requires two lines of code: one to start the sensor in void setup() and one to read it in void loop().
void setup() {
  dht.begin();
}
void loop() {
  float temp = dht.readTemperature(true);
}
Publishing Data to PubNub
In order to publish the data to PubNub, you first need to initialize PubNub, then format the data as a JSON. After that, you can use PubNub's Arduino library to send the message over the MKR's WiFi connection.
Initializing PubNub
To start using PubNub, you first need to input your publish and subscribe keys at the top of your code, then define the channel you'll be using for your data.
char pubkey[] = "demo";
char subkey[] = "demo";
char channel[] = "temperature";
Next you need to initialize PuNub in the setup portion of your code.
PubNub.begin(pubkey, subkey);
Formatting Messages
To convert the data from a float to a JSON, you need to define two helper functions. The first is a commonly used functions that converts the float that the sensor records to a string.
char *dtostrf (double val, signed char width, unsigned char dec, char *s) {
    char m[20];
    sprintf(m, "%%%d.%df", width, dec);
    sprintf(s, m, val);
    return s;
  }
The other function joins long strings together, which you need to do in order to create a JSON.
char longString[100];
char *joinStrings(char* string1, char* string2, char* string3) {
 longString[0] = 0;
 strcat(longString, string1);
 strcat (longString, string2);
 strcat (longString, string3);
 return longString;
}
Using those functions, we can convert the float data into a JSON. If you're using various locations to transmit your data, like I am, then you need to change the “Location” term in the JSON to reflect the different locations. For this project, one of my MKR1000s runs code that says “SoMa” while another says “Ingleside,” and so on.
char msg[200];
dtostrf(temp, 7, 2, msg);
char* json = joinStrings("{\"eon\":{\"Location\":\"", msg, "\"}}");
Now the data is ready to be published.
Sending the Messages
Use the PubNub.publish() method to publish the data to your channel over the WiFi connection.
WiFiClient *client = PubNub.publish(channel, json);
Now use the code below to print the data to the console and add a delay, which help to clean up your data.
while (client->connected()) {
  char c = client->read();
  Serial.print(c);
}
client->stop();
delay(5000);
Visualizing Data with EON and Mapbox
With awesome tools like the EON Chart Builder and Mapbox Editor, you can easily visualize and embed your data anywhere you like in just a couple quick steps. It's pretty self-explanatory for the most part, but I'll walk through it here so you can see how I got to my finished product.
Using EON Chart Builder
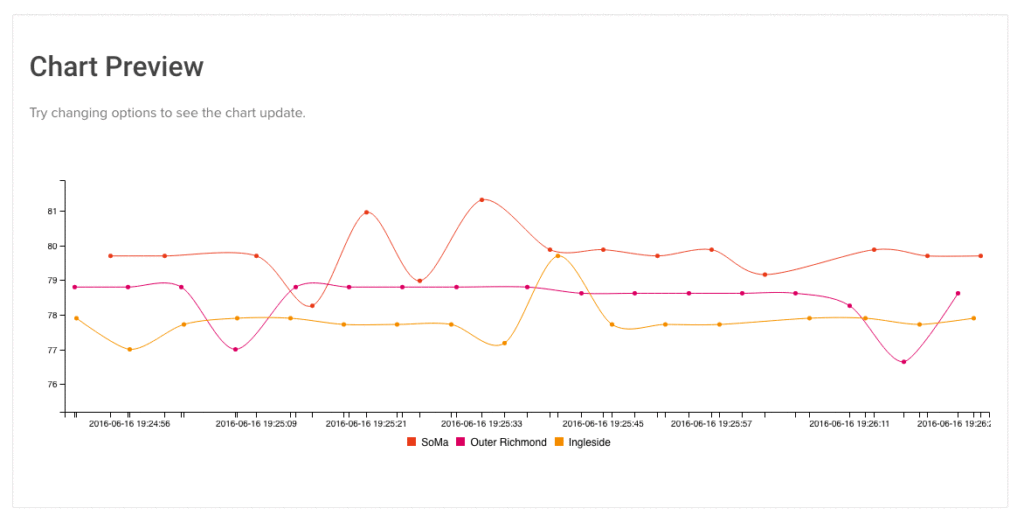
To visualize your data on a graph like the one below, you just need to input your subscribe key and channel name into the EON Chart Builder and adjust the settings to your liking. You can change the colors of your graph, assign labels to the the x and y axes labels, modify the number of data points shown, and indicate whether or not you want to include historical channel data in your project. Then just copy and paste the HTML code at the bottom of the screen to your HTML file. It’s that easy!
Mapping the Data with Mapbox
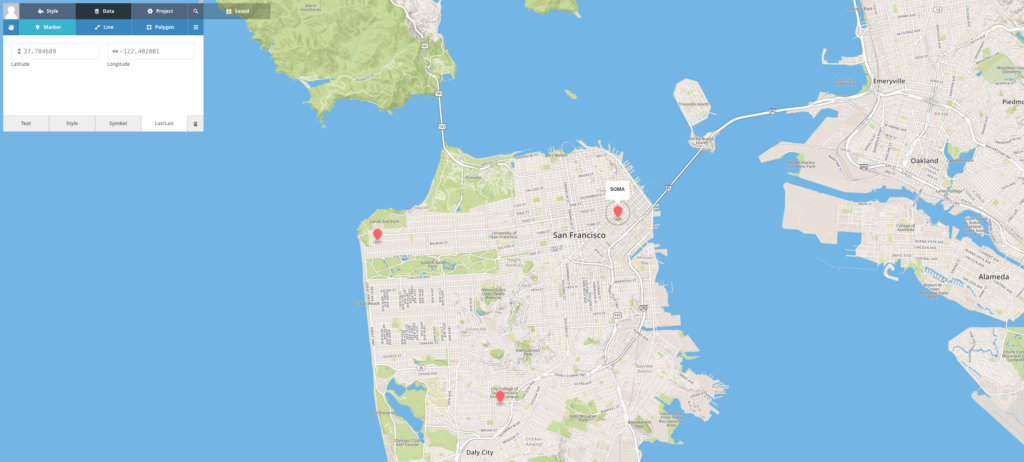
For this project, you can use Mapbox to show the location of your sensor(s) on a map, then tweak the HTML so that your temperature data is visible as well. Start off by making an account if you don’t already have one – it’s free!
Using Mapbox Editor
Your Mapbox account comes with access to a full JavaScript SDK as well as a tool called Mapbox Editor. To get started, just copy and paste the code from the SDK into your HTML, then open up the editor. There, you can customize your map to your liking with just a few clicks and export the additional HTML to your project. Just like that, you’ve got a map to manipulate at your fingertips.
Inserting Temperature Data
To include accurate temperature data in your map, you need to write a function that inputs the collected data into the “description” portion of your marker. Because JavaScript executes code asynchronously, you have to use nested functions to run the code in the order you want it – first retrieve the data using PubNub, then print it to the description box. The first function will retrieve the latest data from PubNub and then call another function, which is specified in the function call.
function getDescription(doanother) {
            pubnub.history({
                channel: "temperature",
                count:3,
                callback: function(m) {
                    somaTemp = JSON.stringify(m);
                    somaTemp = somaTemp.substr(somaTemp.search("So")+9,5);
                    somaTemp = somaTemp + '°F';
                    doanother();
                }
            });
        };
When you call that function, you then need to define another function as a parameter which assigns that value to the description. This forces the code to be executed in the correct order.
getDescription(function() {
            L.mapbox.featureLayer({
                type: 'Feature',
                geometry: {
                    type: 'Point',
                    coordinates: [-122.402801,37.784689]
                },
                properties: {
                    title: 'SoMa',
                    description: somaTemp,
                    'marker-size': 'large',
                    'marker-color': '#f86767',
                }
            }).addTo(map);
        });
And you’re done! You’ve successfully set up your Arduino, linked it with PubNub, and visualized the data using both the EON Chart Builder and Mapbox.
Taking it Further
So there you have it! You’ve now built a wireless distributed temperature monitoring system using just an Arduino MKR1000, a temperature sensor, and a few batteries and wires. With the help of PubNub, you can access this system from almost anywhere in the world. To take it further, you could use the same basic steps to monitor any type of sensor-collected data in real time, whether it’s humidity, light, motion, or anything else you can think of. You could also expand the number of locations you’re using by putting a different MKR in each one, and voila! Your project is global. Armed with a WiFi connection and PubNub, your possibilities are endless.
