AT&T Flow Designer + PubNub: Seamless IoT Dev and Deployment
AT&T Flow Designer is an intuitive visual tool that makes it easy to design, prototype, and deploy IoT solutions. With this web-based tool you can visually create and connect multiple data sources, cloud services, and embedded devices.
With AT&T’s expansive broadband network and focus on IoT, Flow Designer is a perfect match for PubNub’s Data Stream Network. Trigger device action, stream sensor readings, send mobile push notification alerts or track geolocation in real time with PubNub, powered by AT&T Flow Designer.
We're also excited to announce that we're partnering with AT&T for the upcoming Real-time AT&T IoT Starter Kit Challenge on Hackster.io. Harnessing the power of AT&T's new IoT Starter Kit, Flow, and PubNub, hackers across the United States will contend to see who can build the most innovative IoT app. With a ton of great prizes, we hope to see your app!

Introduction
In this tutorial, we’ll build off the knowledge gained from the AT&T guide to demonstrate how PubNub can be integrated into Flow Designer.This tutorial is not technically dependent on that guide, however it is suggested as a prerequisite regardless since it will introduce many general Flow Designer concepts which will be needed for this PubNub Flow tutorial. You will need to create a free AT&T IoT Platform account before diving into this tutorial.
In the first part of this tutorial, we’ll use “demo” API keys to get off the ground quickly. In the second part of this tutorial, we’ll use your own API keys to send data out via Flow. If you don’t have a PubNub account already, go ahead and sign up. Create an App, and then a Keyset, and you’ll be ready to go!
Lets begin!
Login and Create a new Flow
- Using the same credentials as used in the AT&T Flow Designer tutorial, login to Flow Designer at https://flow.att.io/.
- Click the Plus button in the bottom-left hand corner of the screen to create a new Flow.

The Create A New Project screen appears:
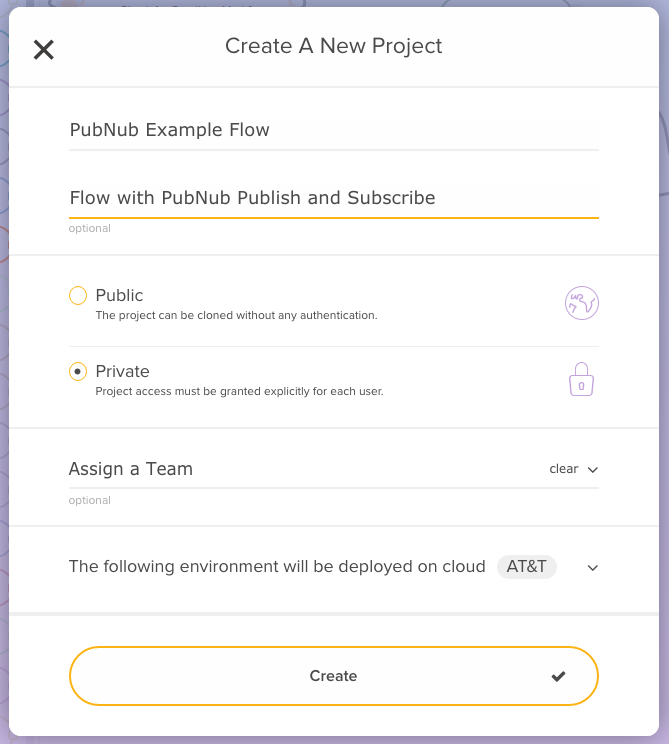
- For Project Name, enter PubNub Example Flow.
- For Description, enter Flow with PubNub Publish and Subscribe.
- Check Private.
- Click Create.
Shortly after clicking Create, you should be presented with an empty Sheet 1 of your new Flow.
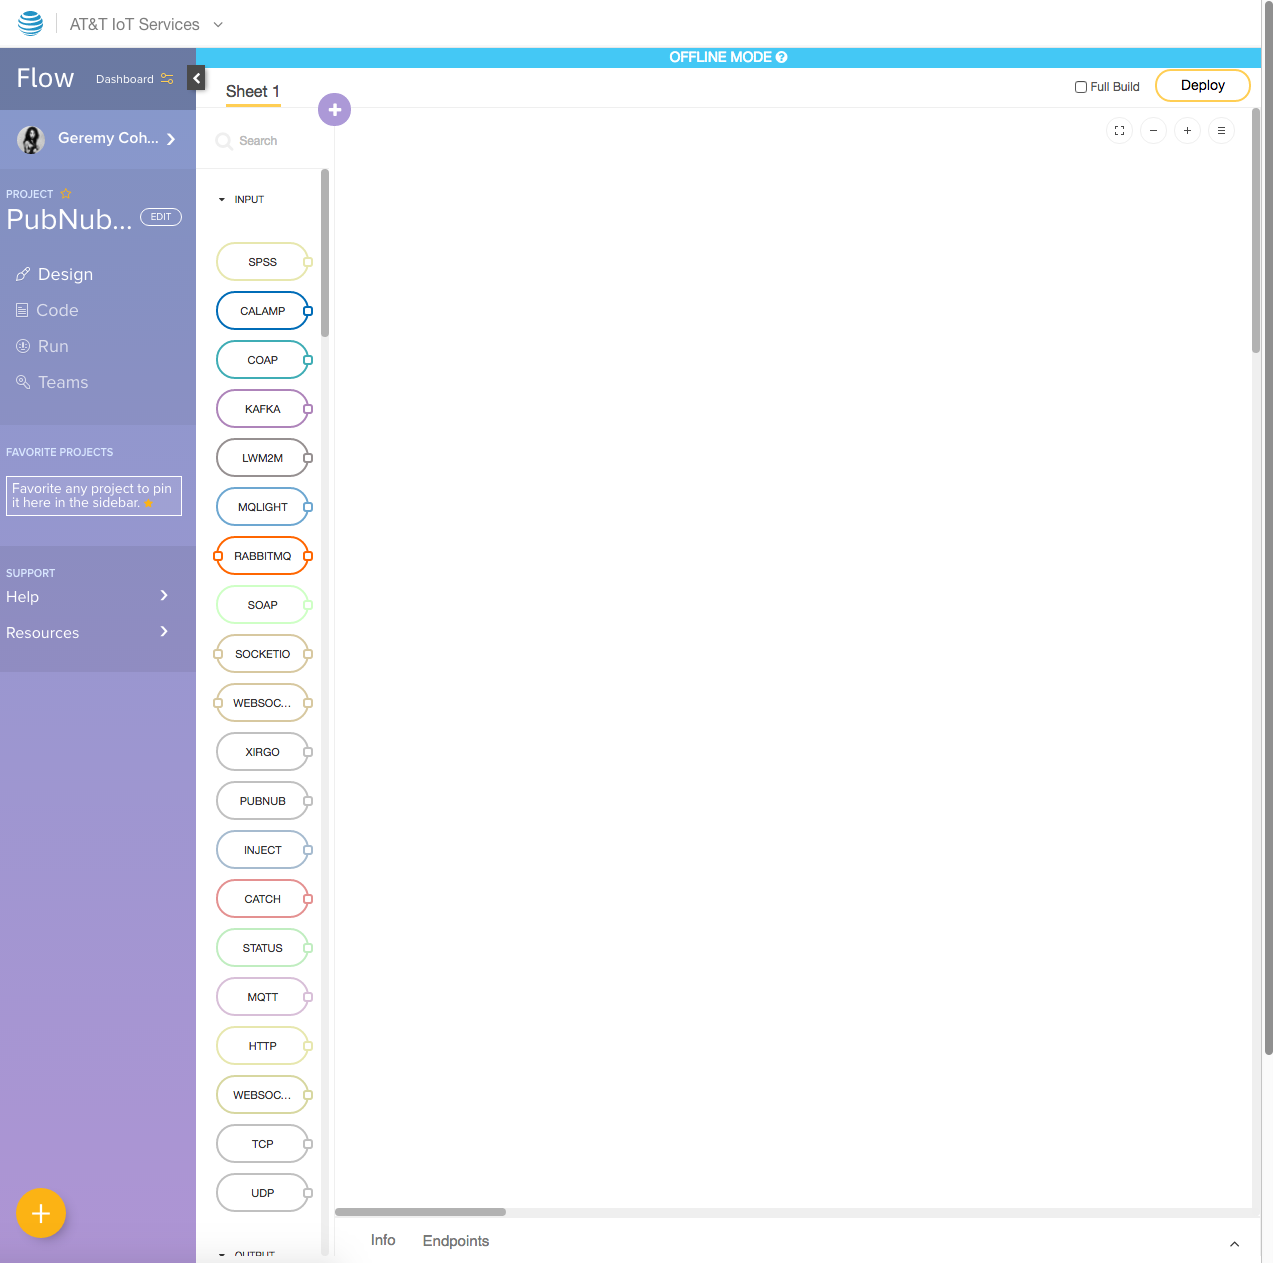
Now that we have our blank canvas, we’ll wire up the nodes of the flow.
Creating a PubNub Input Node
To create the subscriber PubNub input node:
- From the Input section of the Flow UI, drag a PUBNUB node onto the canvas.
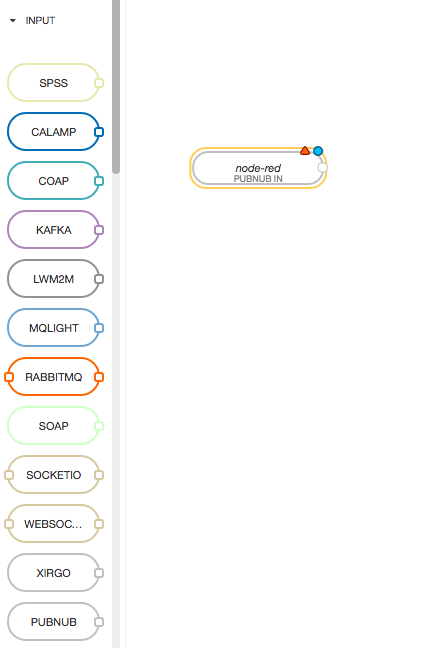
- Double-click on the node to bring up its configuration options.
- Click the Edit (pencil) icon next to Keys.
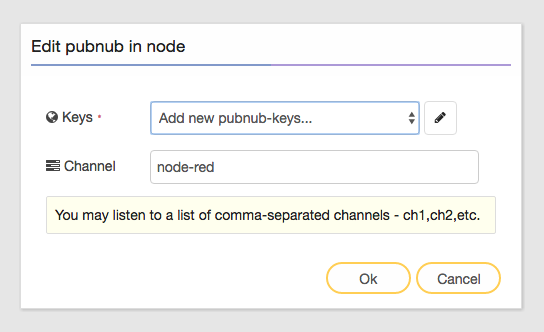
- For the Publish Key, set attflow.
- For the Subscribe Key, set attflow.
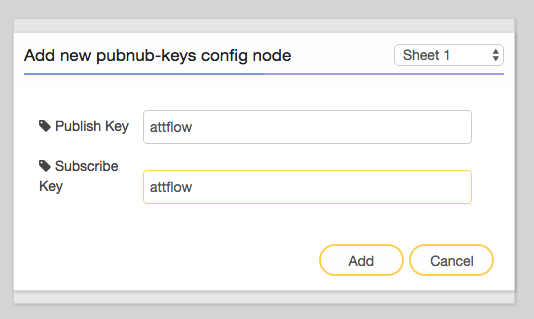
- Click Add.
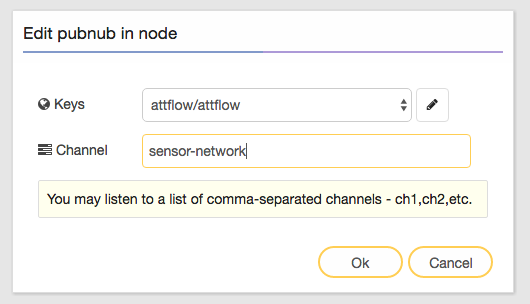
- For the Channel, enter sensor-network.
Your editor should now look similar to the figure below:
- Click Ok.
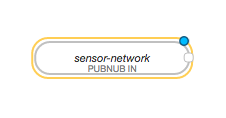
Your node should now resemble the figure below:
Since we just configured PubNub to subscribe to a live feed, we’ll connect a Flow Debug node to the PUBNUB IN (subscriber) node to get a live view of the data.
Creating the Debug Node for the PubNub Subscriber Node
To get a live view of the data produced from the PUBNUB IN node, we’ll connect a debug node to it.
- Click in the Search field located above the Sheet 1 tab.
- Type debug into the Search field.
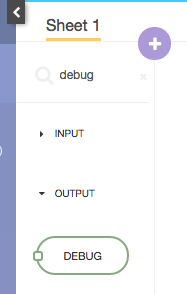
A short list of matching nodes appear.
- Drag the DEBUG node out from the menu panel to the right of the PUBNUB IN node.
- Draw a connector from the right-side of the PUBNUB IN node, to the left-side of the DEBUG node.
- Click the Deploy button at the upper-right of the screen to view our flow in action!

Once the deploy completes, at the bottom of the screen, you’ll see a Debug menu item.

- Click Debug.
You should see the PubNub sensor-network datastream output displayed in the Debug console.
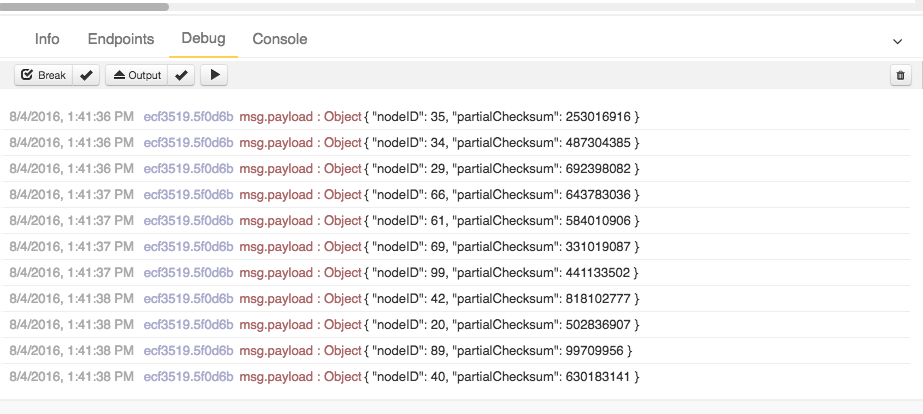
The Debug node’s output can be toggled on and off via the green indicator button located directly to the right of the Debug node:

In addition to using the Flow Designer's Debug console to monitor PubNub traffic, you can also use the PubNub Developer Console to view this and other PubNub datastreams. A link to the PubNub Developer Console, preconfigured with the sensor-network channel and key config, can be found here.
NOTE: Via Access Manager, this keyset and channel has been locked down to prevent unauthorized publishing. Feel free to create your own PubNub app and keyset to use the PubNub Developer Console with your own data!
We’ve demonstrated how to create a PubNub Input (subscriber) node in Flow Designer. Next, we’ll demonstrate how to create a PubNub Output (publish) node.
Creating a PubNub Output Node
Getting PubNub data into Flow Designer is just half of the equation. The second half is to use PubNub to stream data out of Flow Designer. In this next example, we’ll demonstrate how to do just that.
- From the Output section of the Flow UI, drag a PUBNUB node onto the canvas.
- Double click on this PUBNUB OUT node to modify its settings.
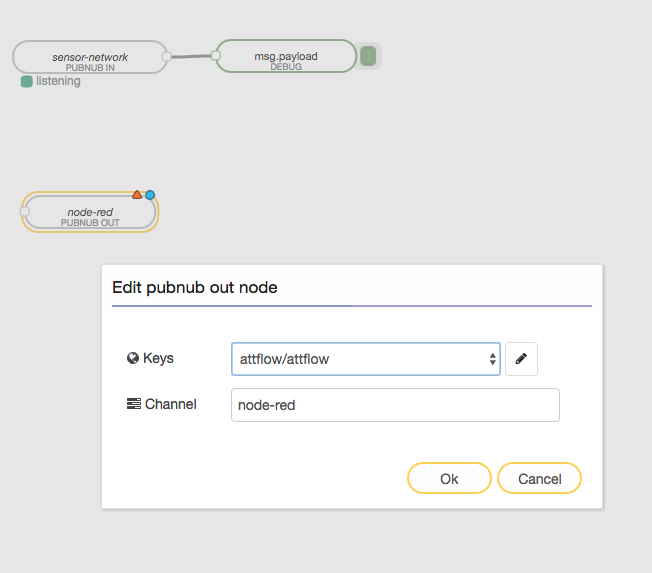
In the first example, we defined the attflow/attflow config. Since we’ll be publishing out on a different (your own) key this time, we’ll defined a new config, based on your very own subscribe and publish keys. If you don’t have them already, go ahead and signup now.
- Click on the attflow/attflow dropdown, and select, Add new pubnub-keys…
- Click on the Edit (pencil) icon next to the dropdown.
- For the Publish Key, set your publish key.
- For the Subscribe Key, set your subscribe key.
- Click Add.
- For Channel, set flow-output.
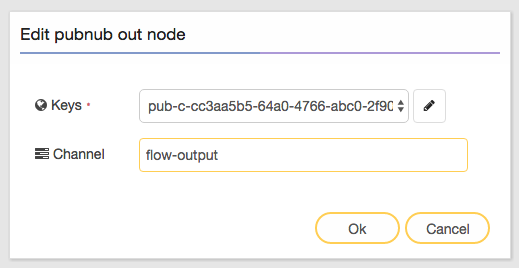
- Click Ok.
NOTE: You can use and set any arbitrary channel names (they are arbitrary and unlimited) but for this example, we’ll choose to publish our data out on the flow-output channel.
Your node should now resemble the following:

A PubNub output (publish) node can send out any JSON data, be it Integer, Boolean, String, or Object. The data can be programmatically created via a function node, or it can be data that Flow already pre-processed and handled.
To simplify this output example, we’ll just publish a timestamp integer by way of the Inject node.
- Click in the Search field located above the Sheet 1 tab.
- Type inject into the Search field.
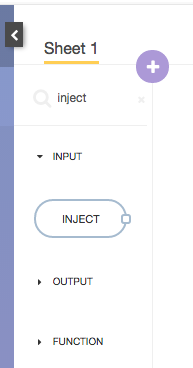
A short list of matching nodes appear.
- Drag the INJECT node out from the menu panel to the right of the newly created PUBNUB OUT node.
- Draw a connector from the left-side of the PUBNUB OUT node, to the right-side of the INJECT node.

- Click the Deploy button at the upper-right of the screen to save the changes.
In our first example, we used a Flow DEBUG node to output PubNub channel data to Flow Designer's Debug console. In addition to using this debug tool built into Flow, we can also use the PubNub Developer Console to view and troubleshoot the data as well.
- Bring up the PubNub Developer Console.
- In the Publish Key field, enter your publish key.
- In the Subscribe Key field, enter your subscribe key.
- In the Channel field, enter flow-output.
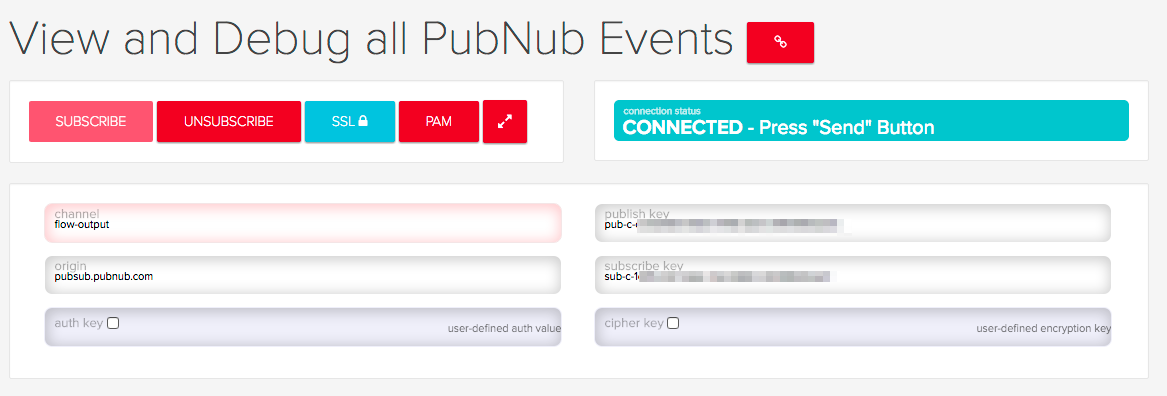
- Click the Subscribe button.
If the credentials are valid, you should see a message similar to:

In the console output field.
- Click the INJECT node’s left-side button, to send a timestamp through to the PUBNUB OUT (publish) node.

- Switch back to the PubNub Developer Debug Console.
You should see the output of the INJECT operation in the form of a JSON message output.

Conclusion
This tutorial served as a general introduction of using PubNub Datastreams with AT&T Flow Designer; it introduced the PubNub Input (subscriber) and Output (publish) nodes, as well as debugging tools on both the Flow Designer and PubNub sides. From here you can connect multiple PubNub streams to Flow, as well as integrate with other interesting datasources and hardware.
If you have any feedback or support questions please feel free to contact us at support@pubnub.com.
If you'd like more info on seeing PubNub work with AT&T, check out these webinars on AT&T Flow Designer and the AT&T Iot Starter Kit: