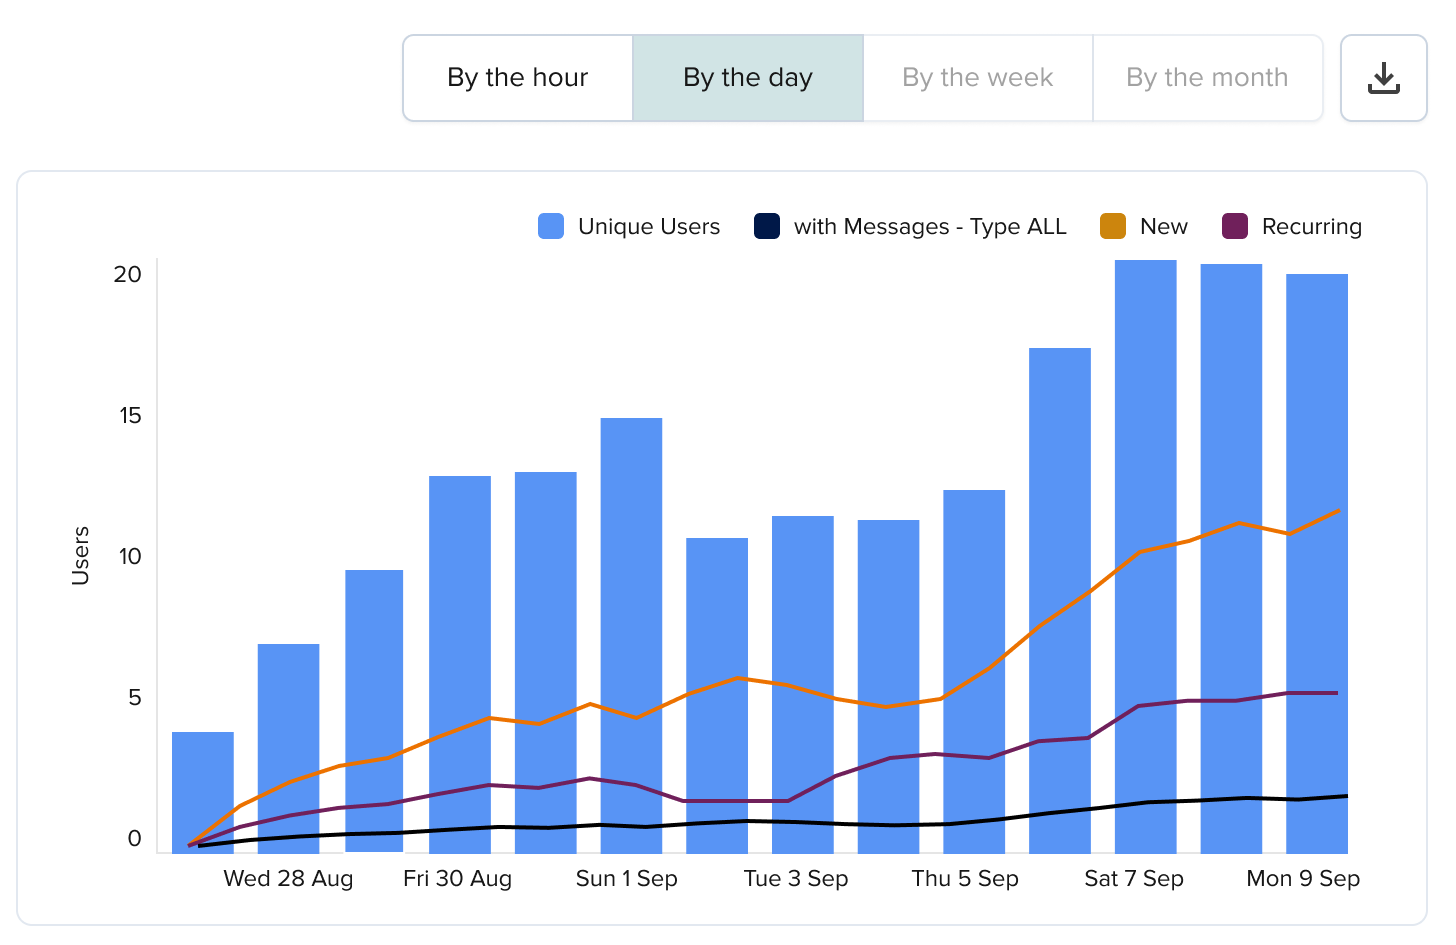
Users Dashboard
The Users dashboard shows analytics for unique users in your Pub/Sub API.
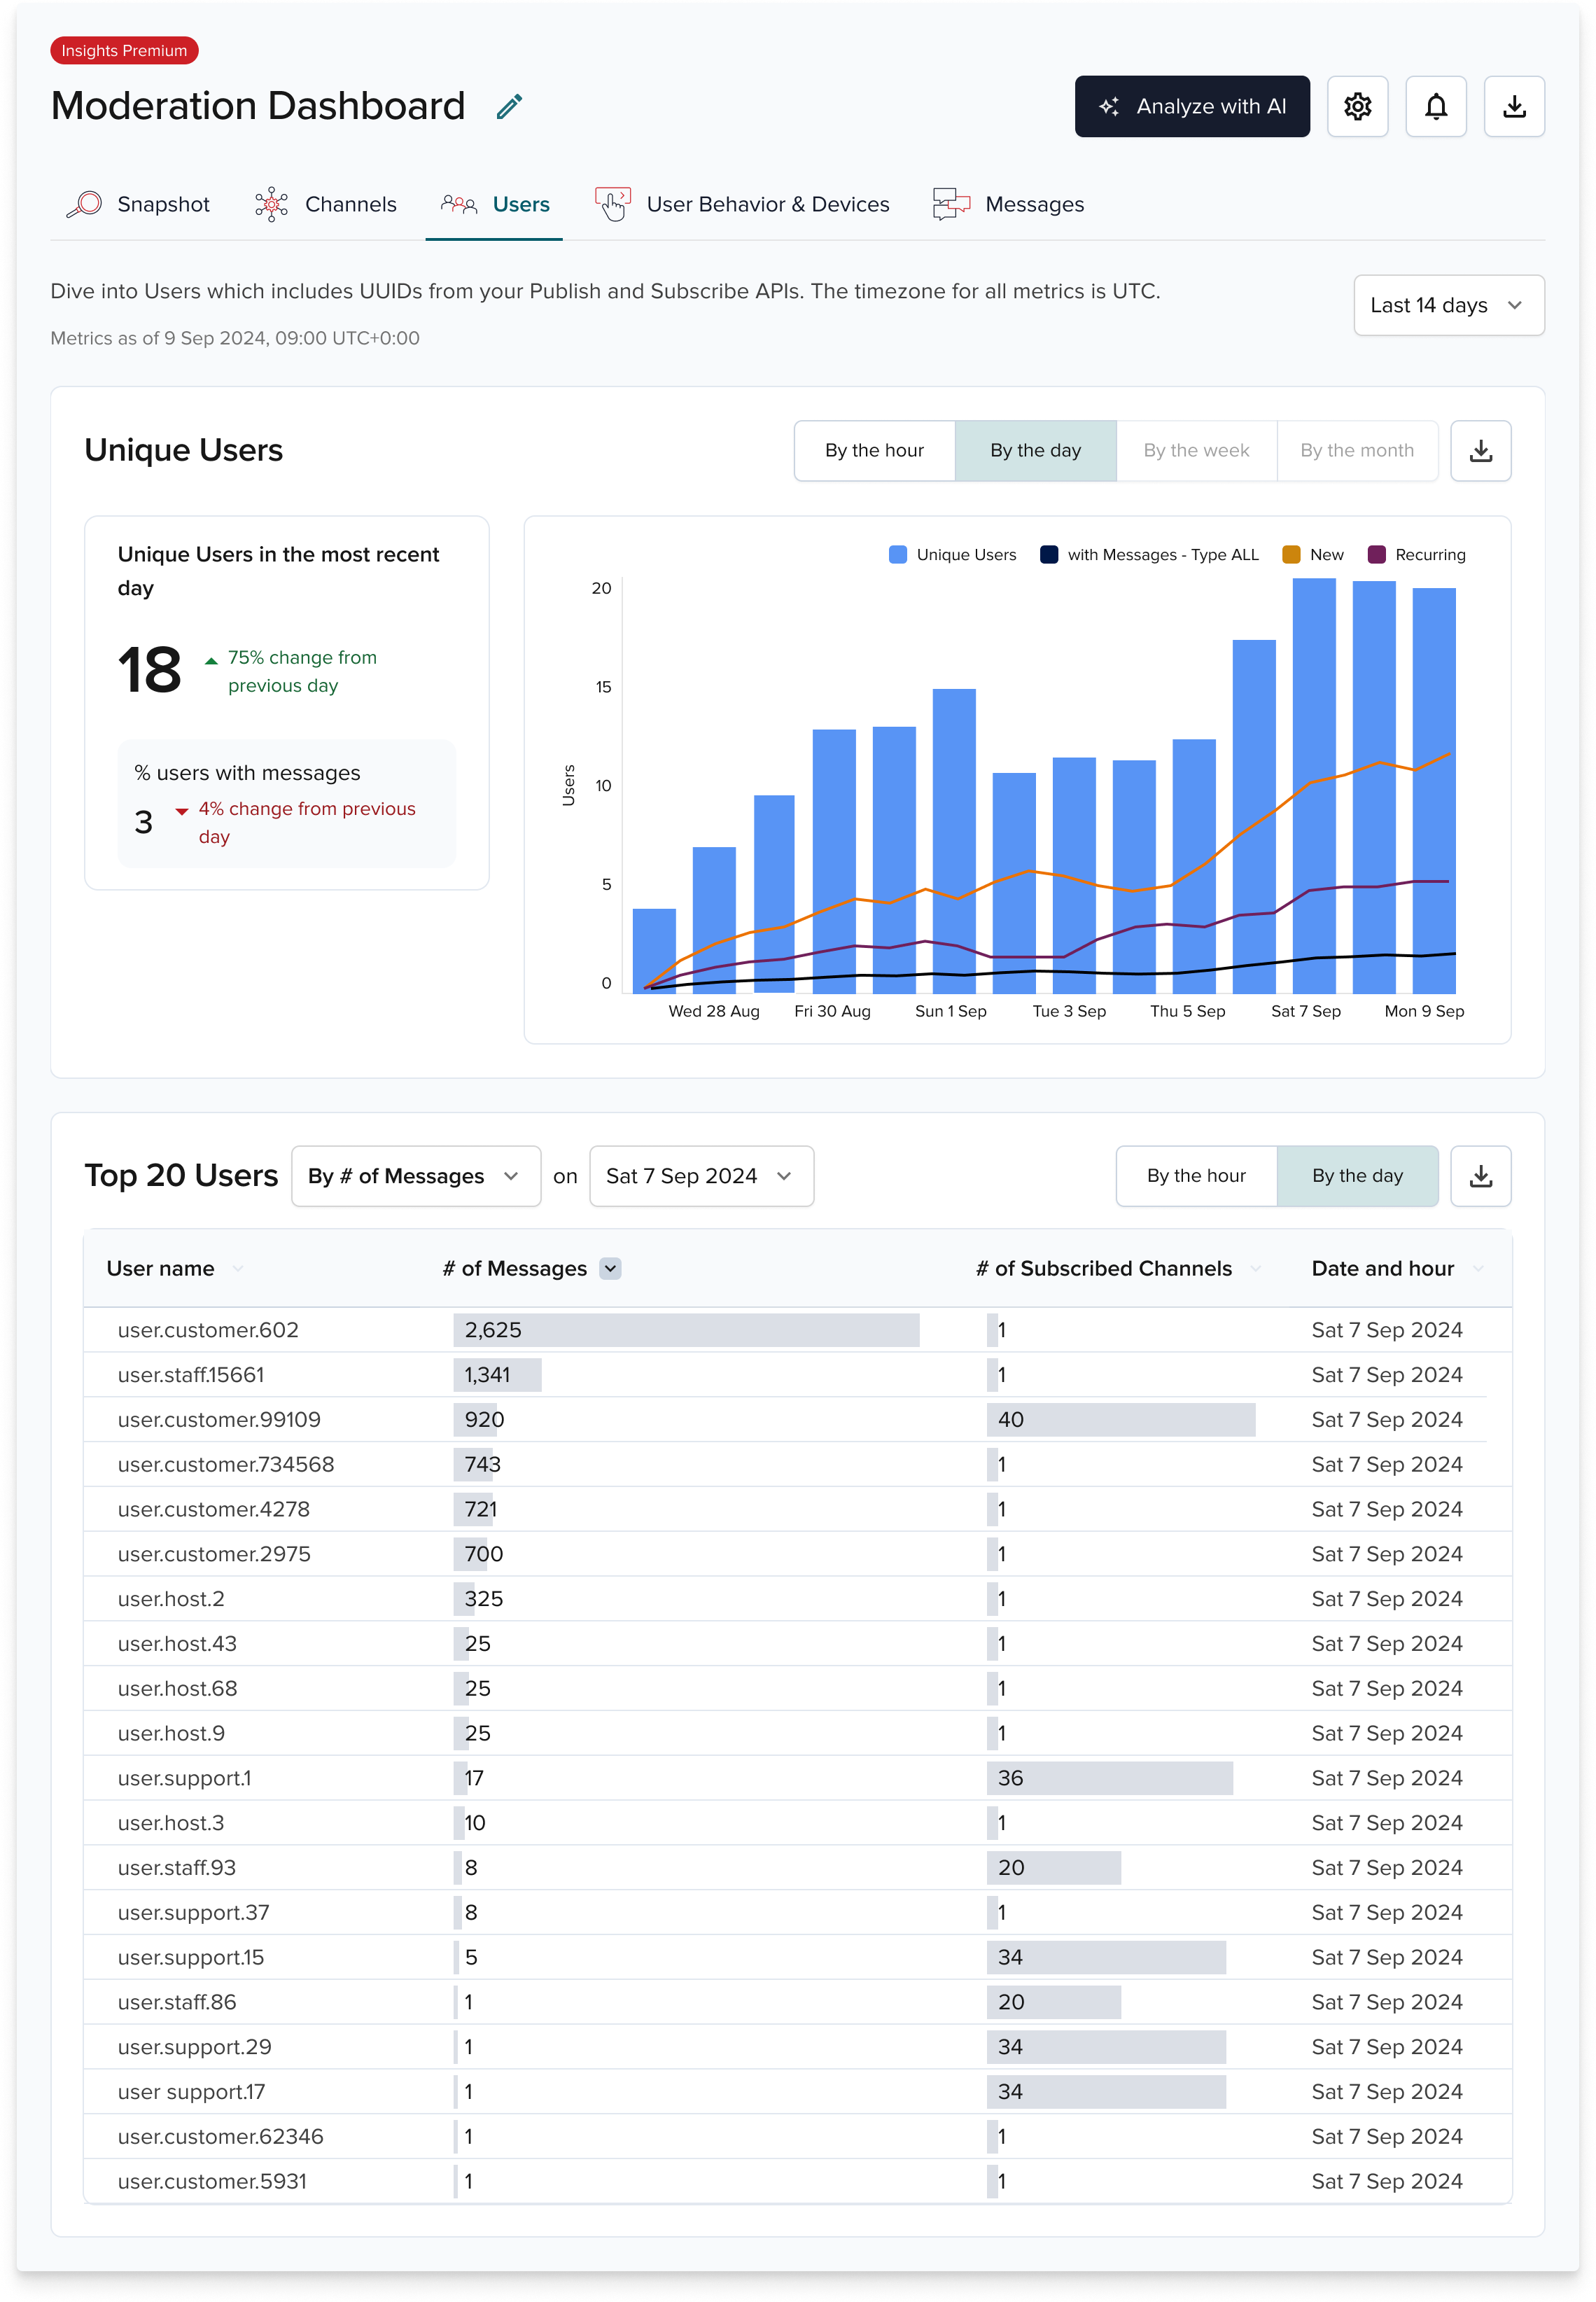
Standard shows hourly metrics. Premium adds daily, weekly, and monthly metrics.
Top 20 Users are based on:
- Number of messages
- Number of subscribed channels
Unique counts
Top 20 users are unique and can't be summed. Select a single hour or date.
New and recurring users
In Premium, you can track new and recurring users. Insights compares UUIDs for today, this week, or this month to the prior period.
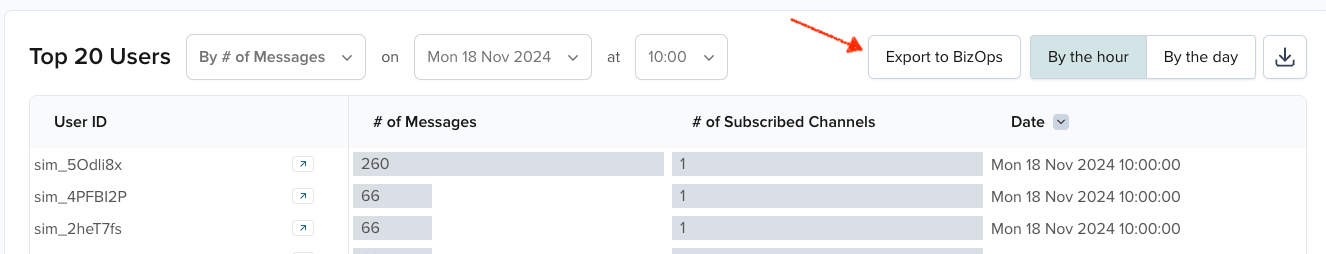
Insights & BizOps
PubNub Insights works with BizOps Workspace. You can export user data and view it in User Management.
Export data
If you have BizOps access and App Context enabled on your keyset, you can send user data from PubNub Insights to BizOps Workspace.
Select Export to BizOps to create the top 20 users in User Management.
Required Admin Portal roles
To export data to BizOps, you need the Bizops Objects Operator role in the Admin Portal, plus the PubNub Insights role.
After export, data is saved in App Context and displayed in User Management.
Imported users include:
- Name equals the ID from Insights
typeset toimportedsent_messagesset to the count at export time (used to pick the top 20)
Existing user data in App Context is skipped to avoid duplicates.
View data
From the Top 20 Users table, select the arrow next to a user to view details.
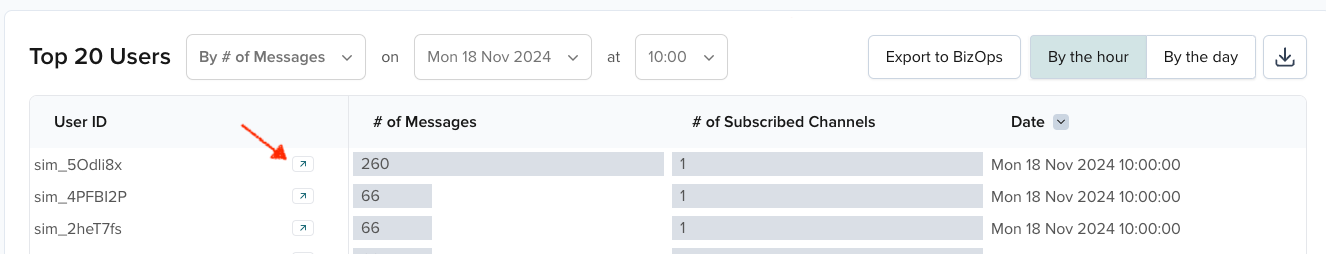
BizOps opens Channel Management with details for the selected user.