Channels Dashboard
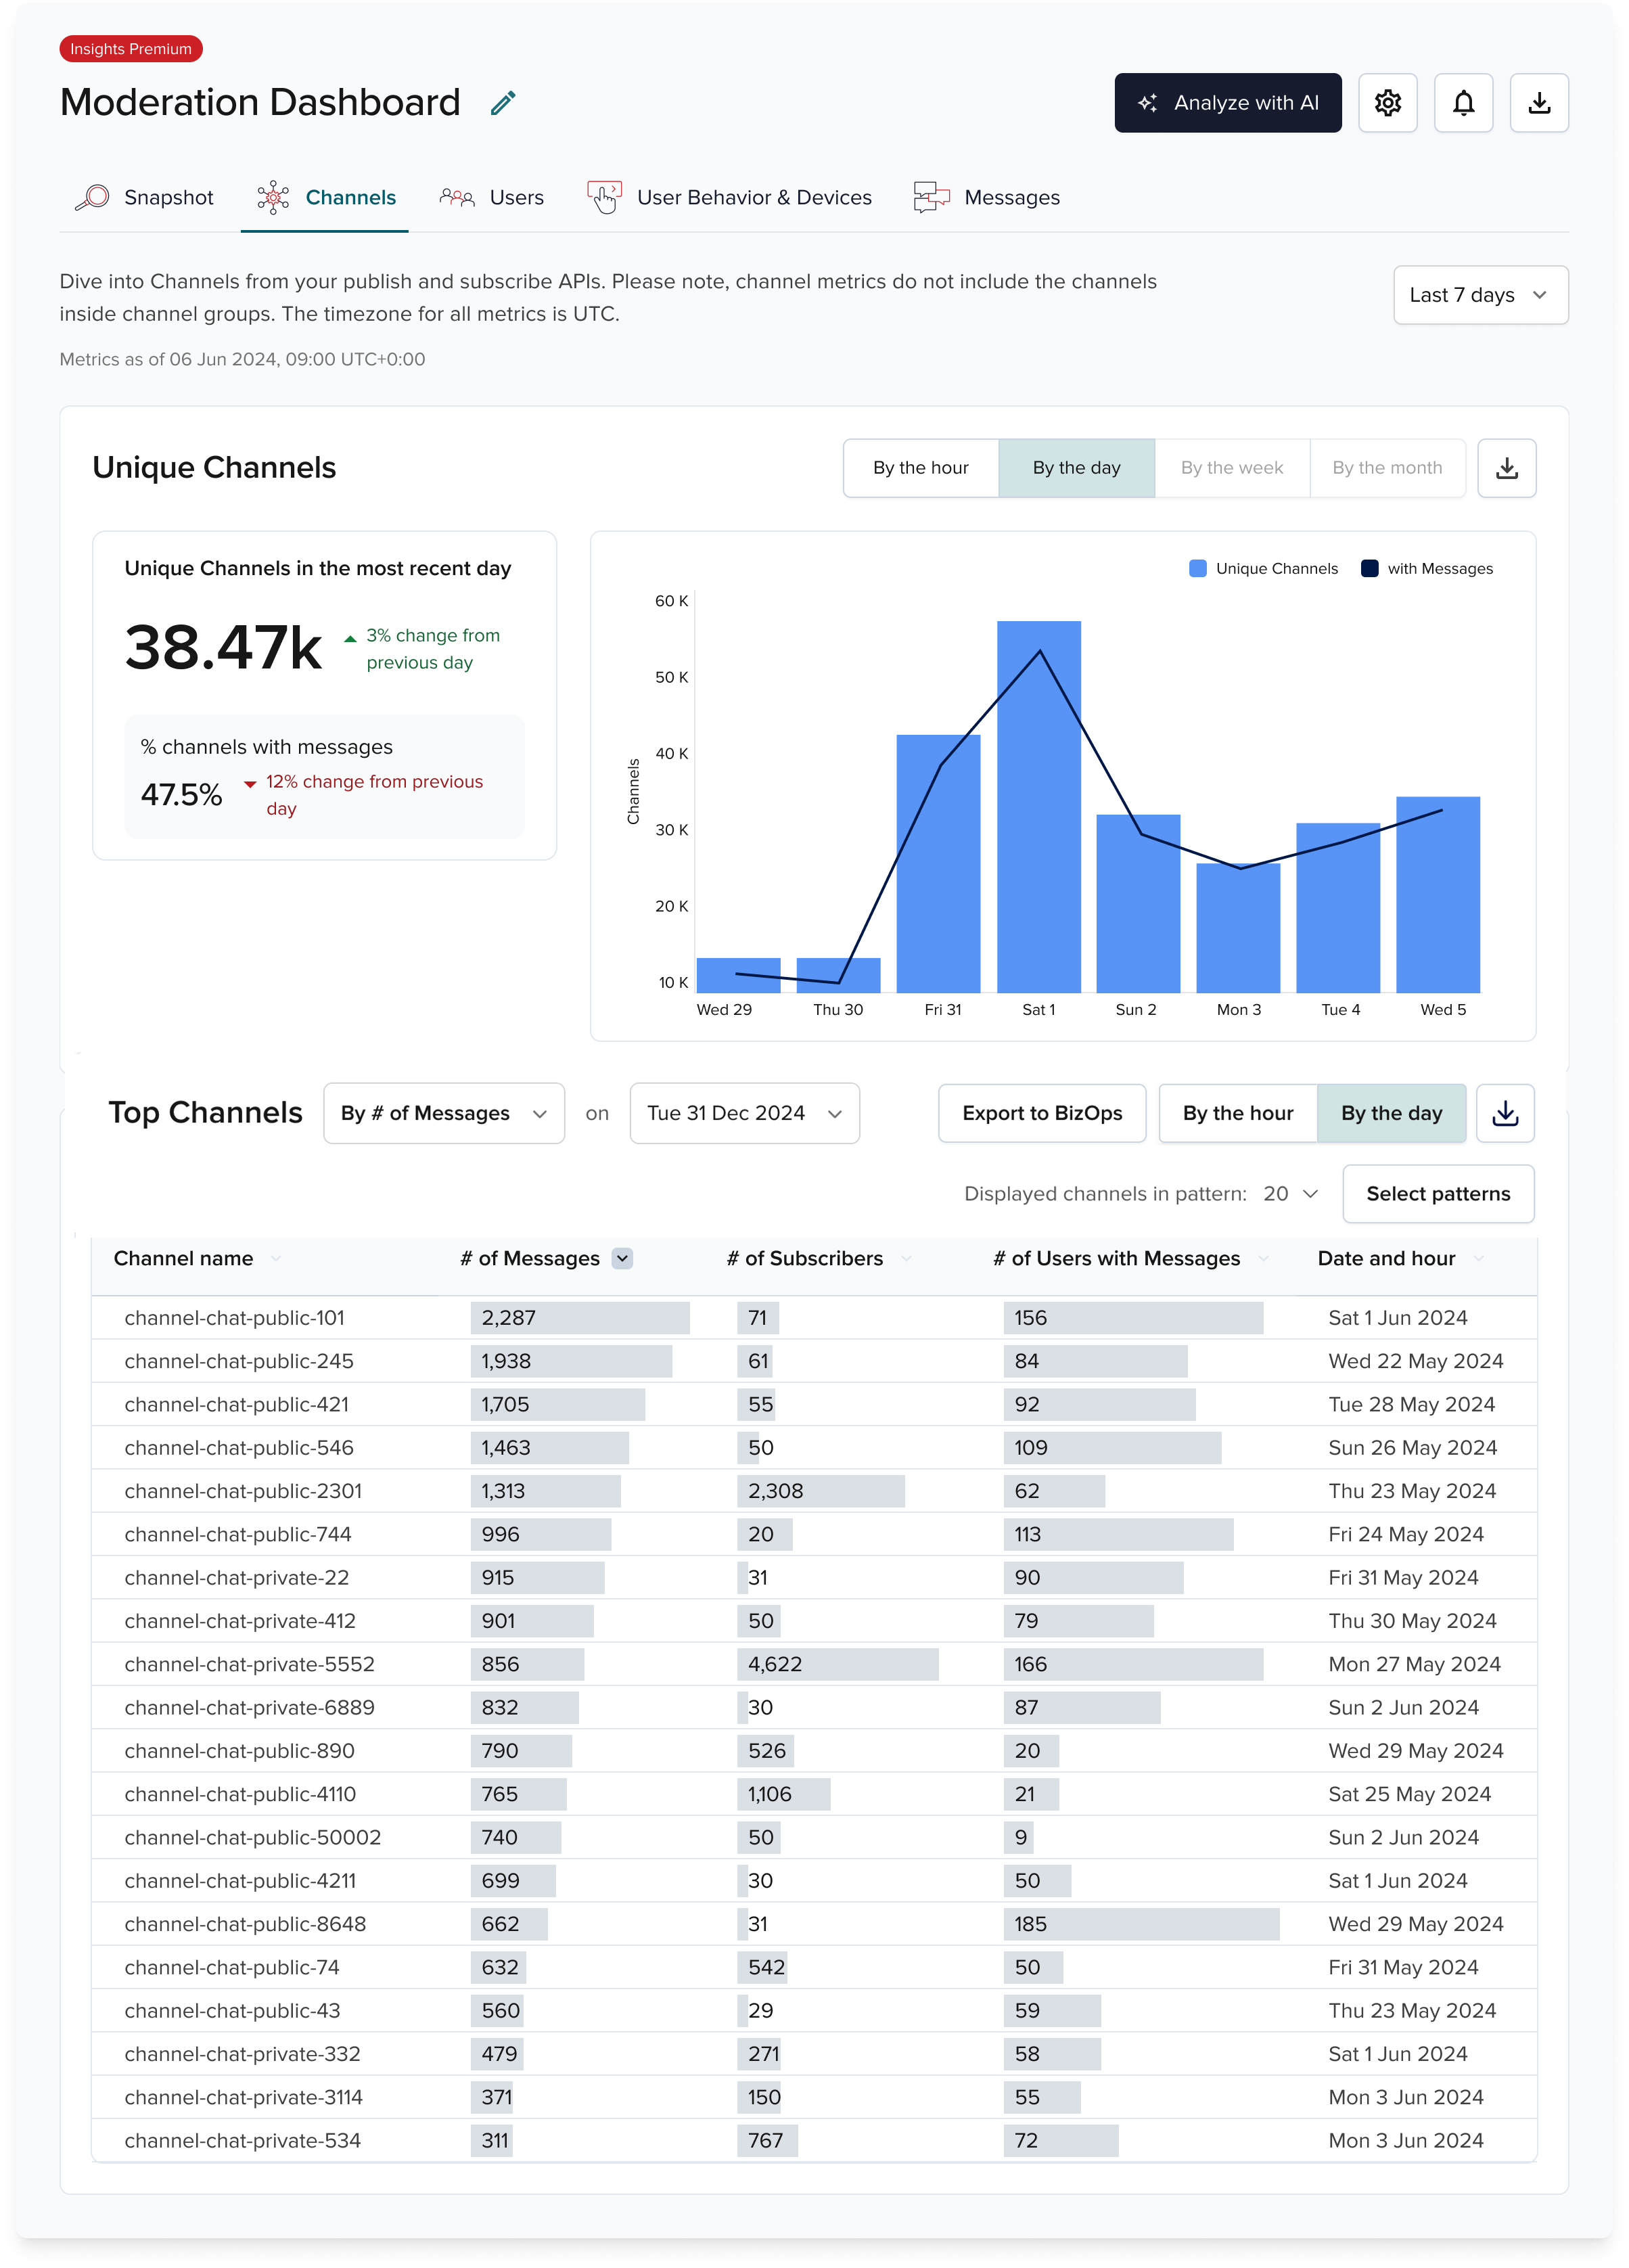
The Channels dashboard shows detailed analytics for unique channels in your Publish/Subscribe (Pub/Sub) API.
Channel Groups
The Channels dashboard shows individual channels only. Channel groups are excluded.
Standard shows hourly metrics. Premium adds daily, weekly, and monthly metrics.
With Premium, you can group by channel patterns to view pattern metrics alongside individual channels. See Metrics for channel pattern details.
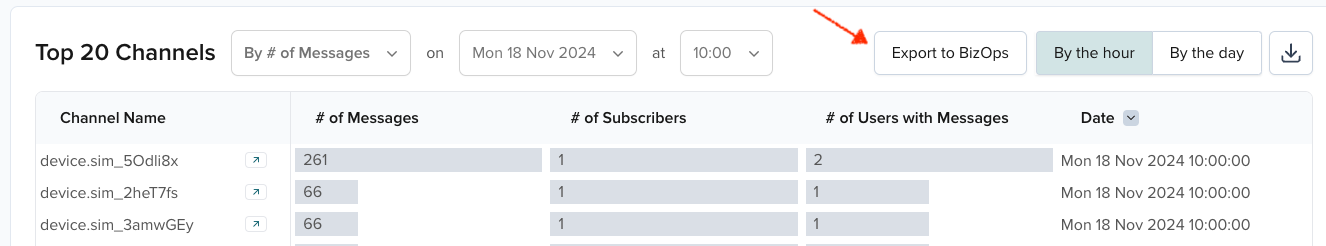
The Top Channels are based on:
- Number of messages
- Number of subscribers
- Number of users with messages
Unique counts
The Top 20 channels are unique and can't be summed. Select a single hour or date.
Insights & BizOps
PubNub Insights integrates with BizOps Workspace. You can export channel data and view it in Channel Management.
Export data
If you have access to BizOps Workspace and App Context enabled on your keyset, you can send channel data from PubNub Insights to BizOps Workspace.
Select Export to BizOps to create the top 20 channels in Channel Management.
Required Admin Portal roles
To export data to BizOps, you need the Bizops Objects Operator role in the Admin Portal, plus the PubNub Insights role.
After export, data is saved in App Context and displayed in Channel Management.
Imported channels have:
- The name that matches the ID imported from Insights
- The
importedvalue assigned to thetypefield - The
sent_messagescustom field with the fixed number of messages at import time (criteria used for the top 20 selection)
Any PubNub Insights channel data already present in App Context is skipped to avoid duplicates.
View data
You can view details of individual channels from the Top 20 Channels table in Insights by selecting the arrow next to the channel name.
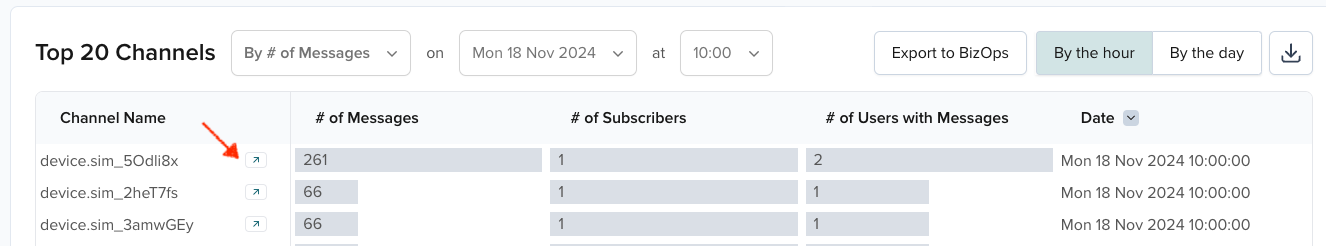
The Channel Management page opens in BizOps Workspace with the details of the channel you selected.