Messages Dashboard
The Messages dashboard shows message data on your channels. You can explore it quickly.
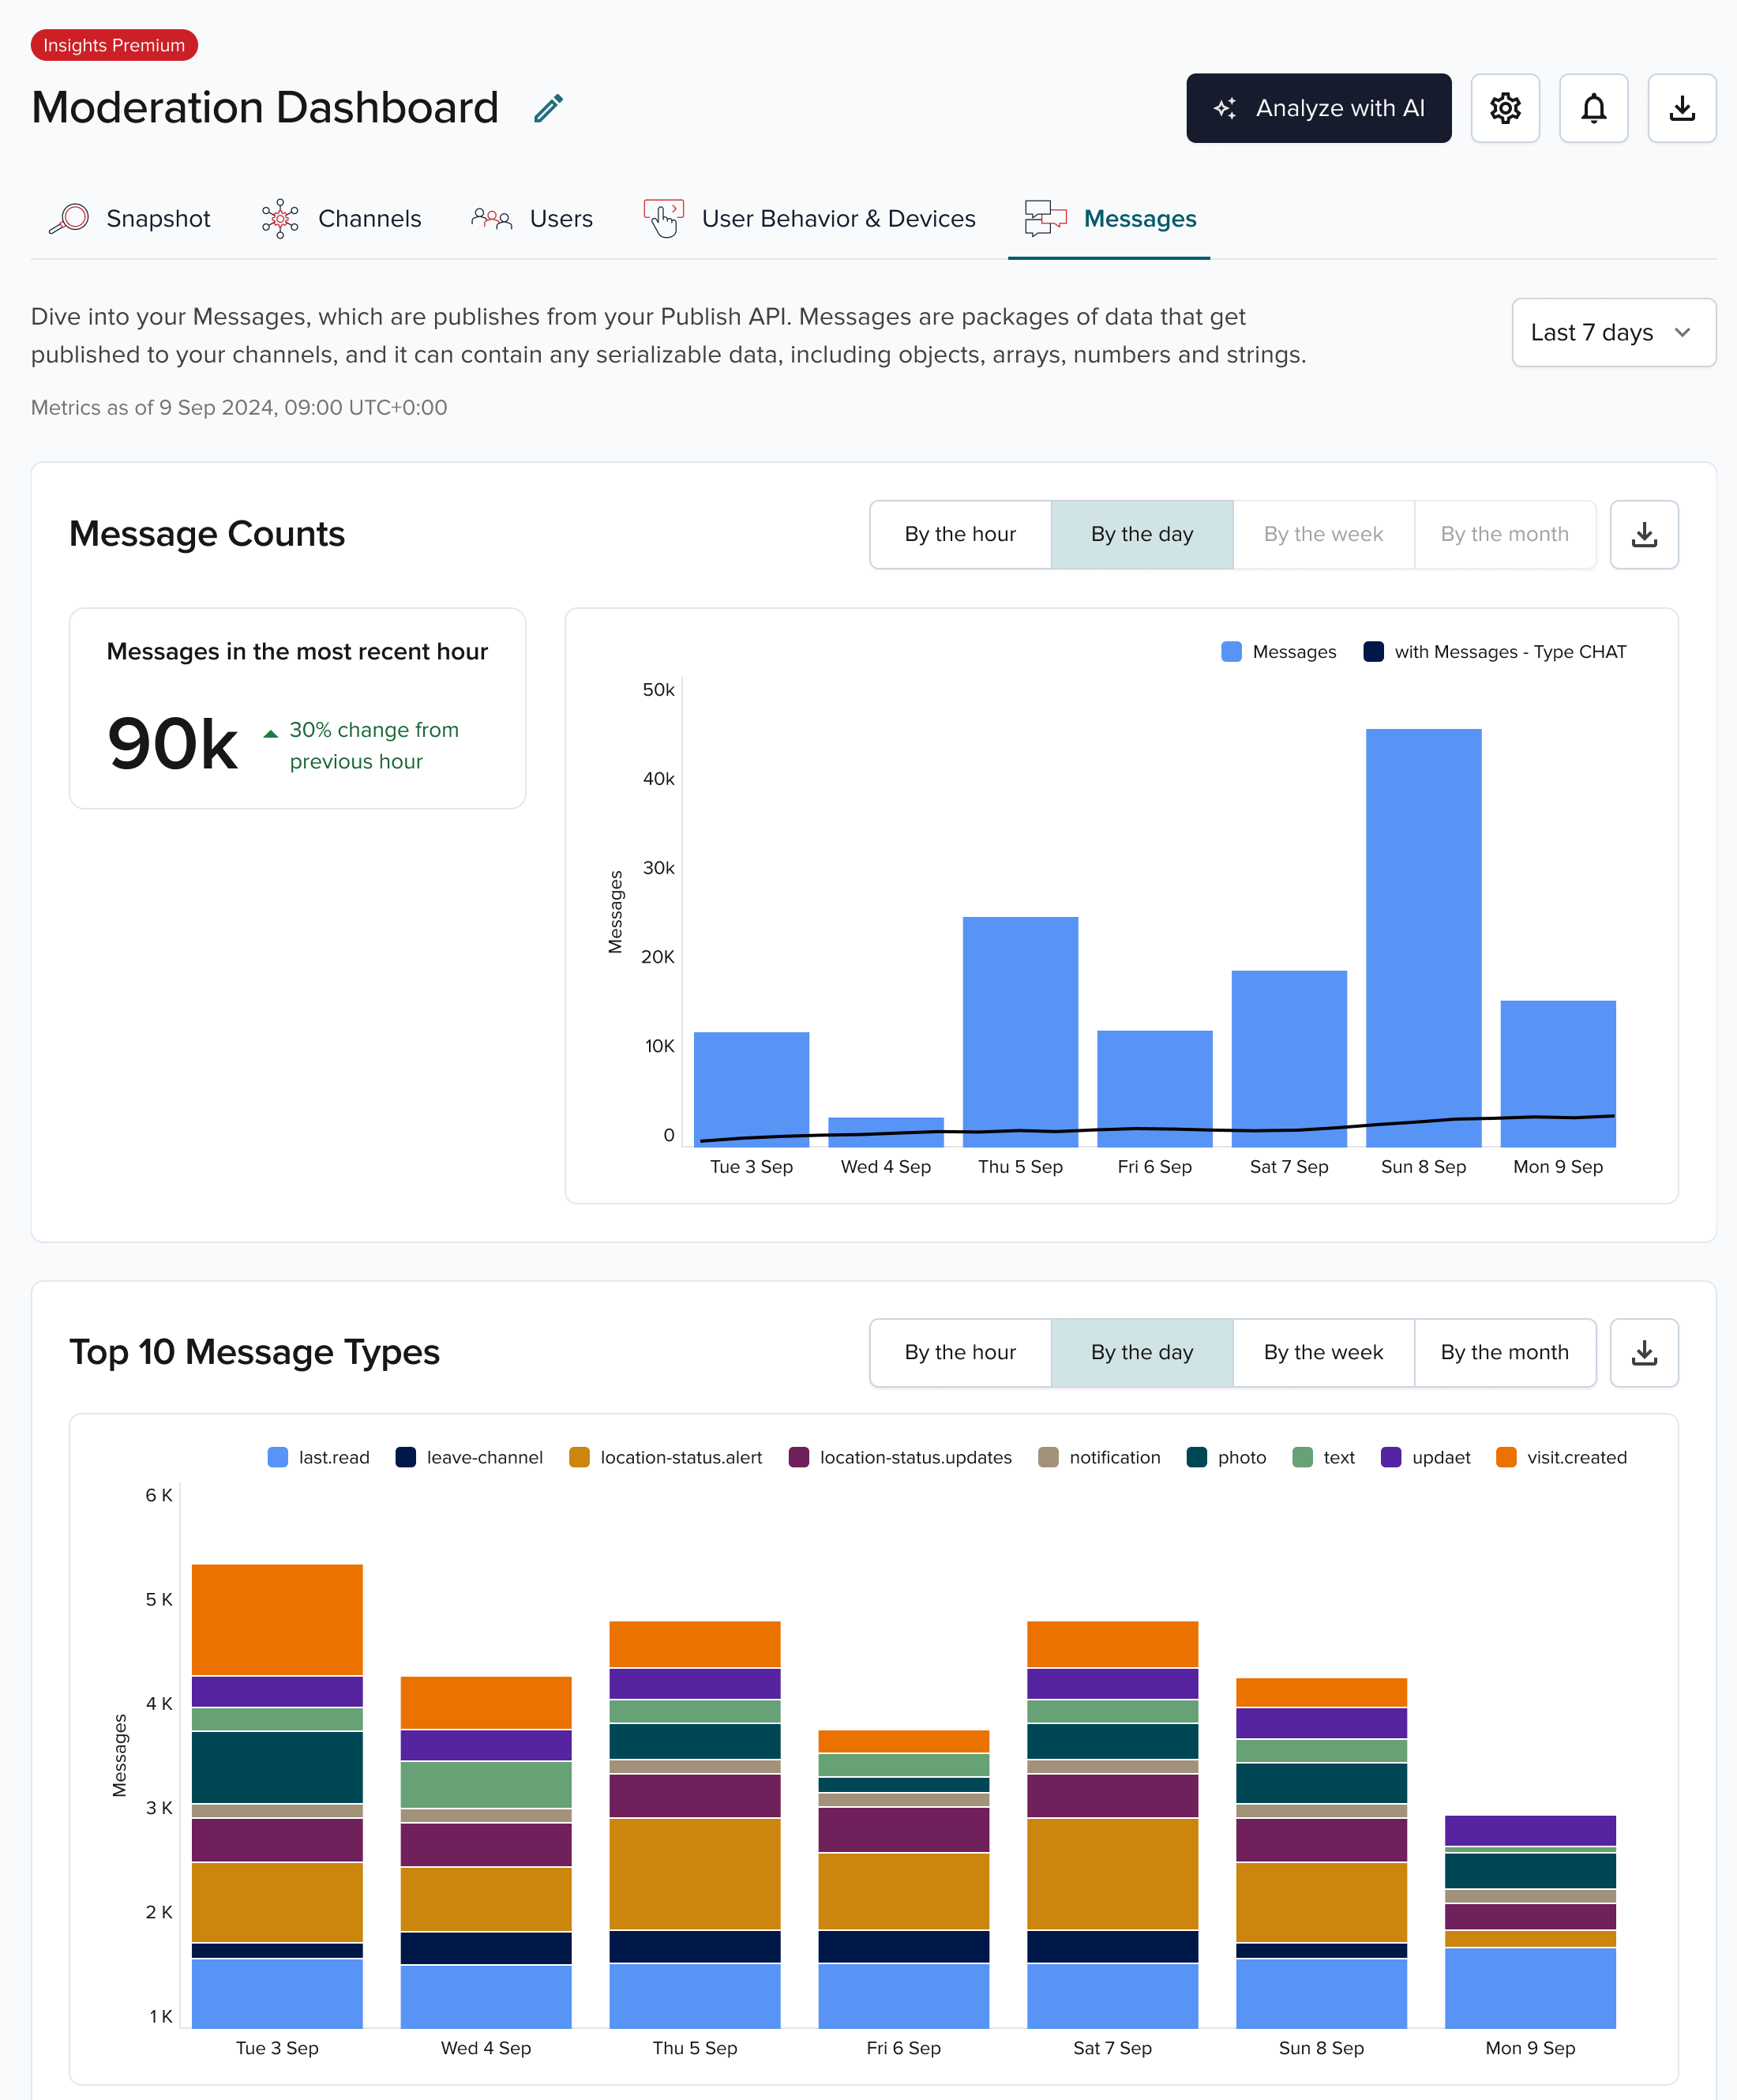
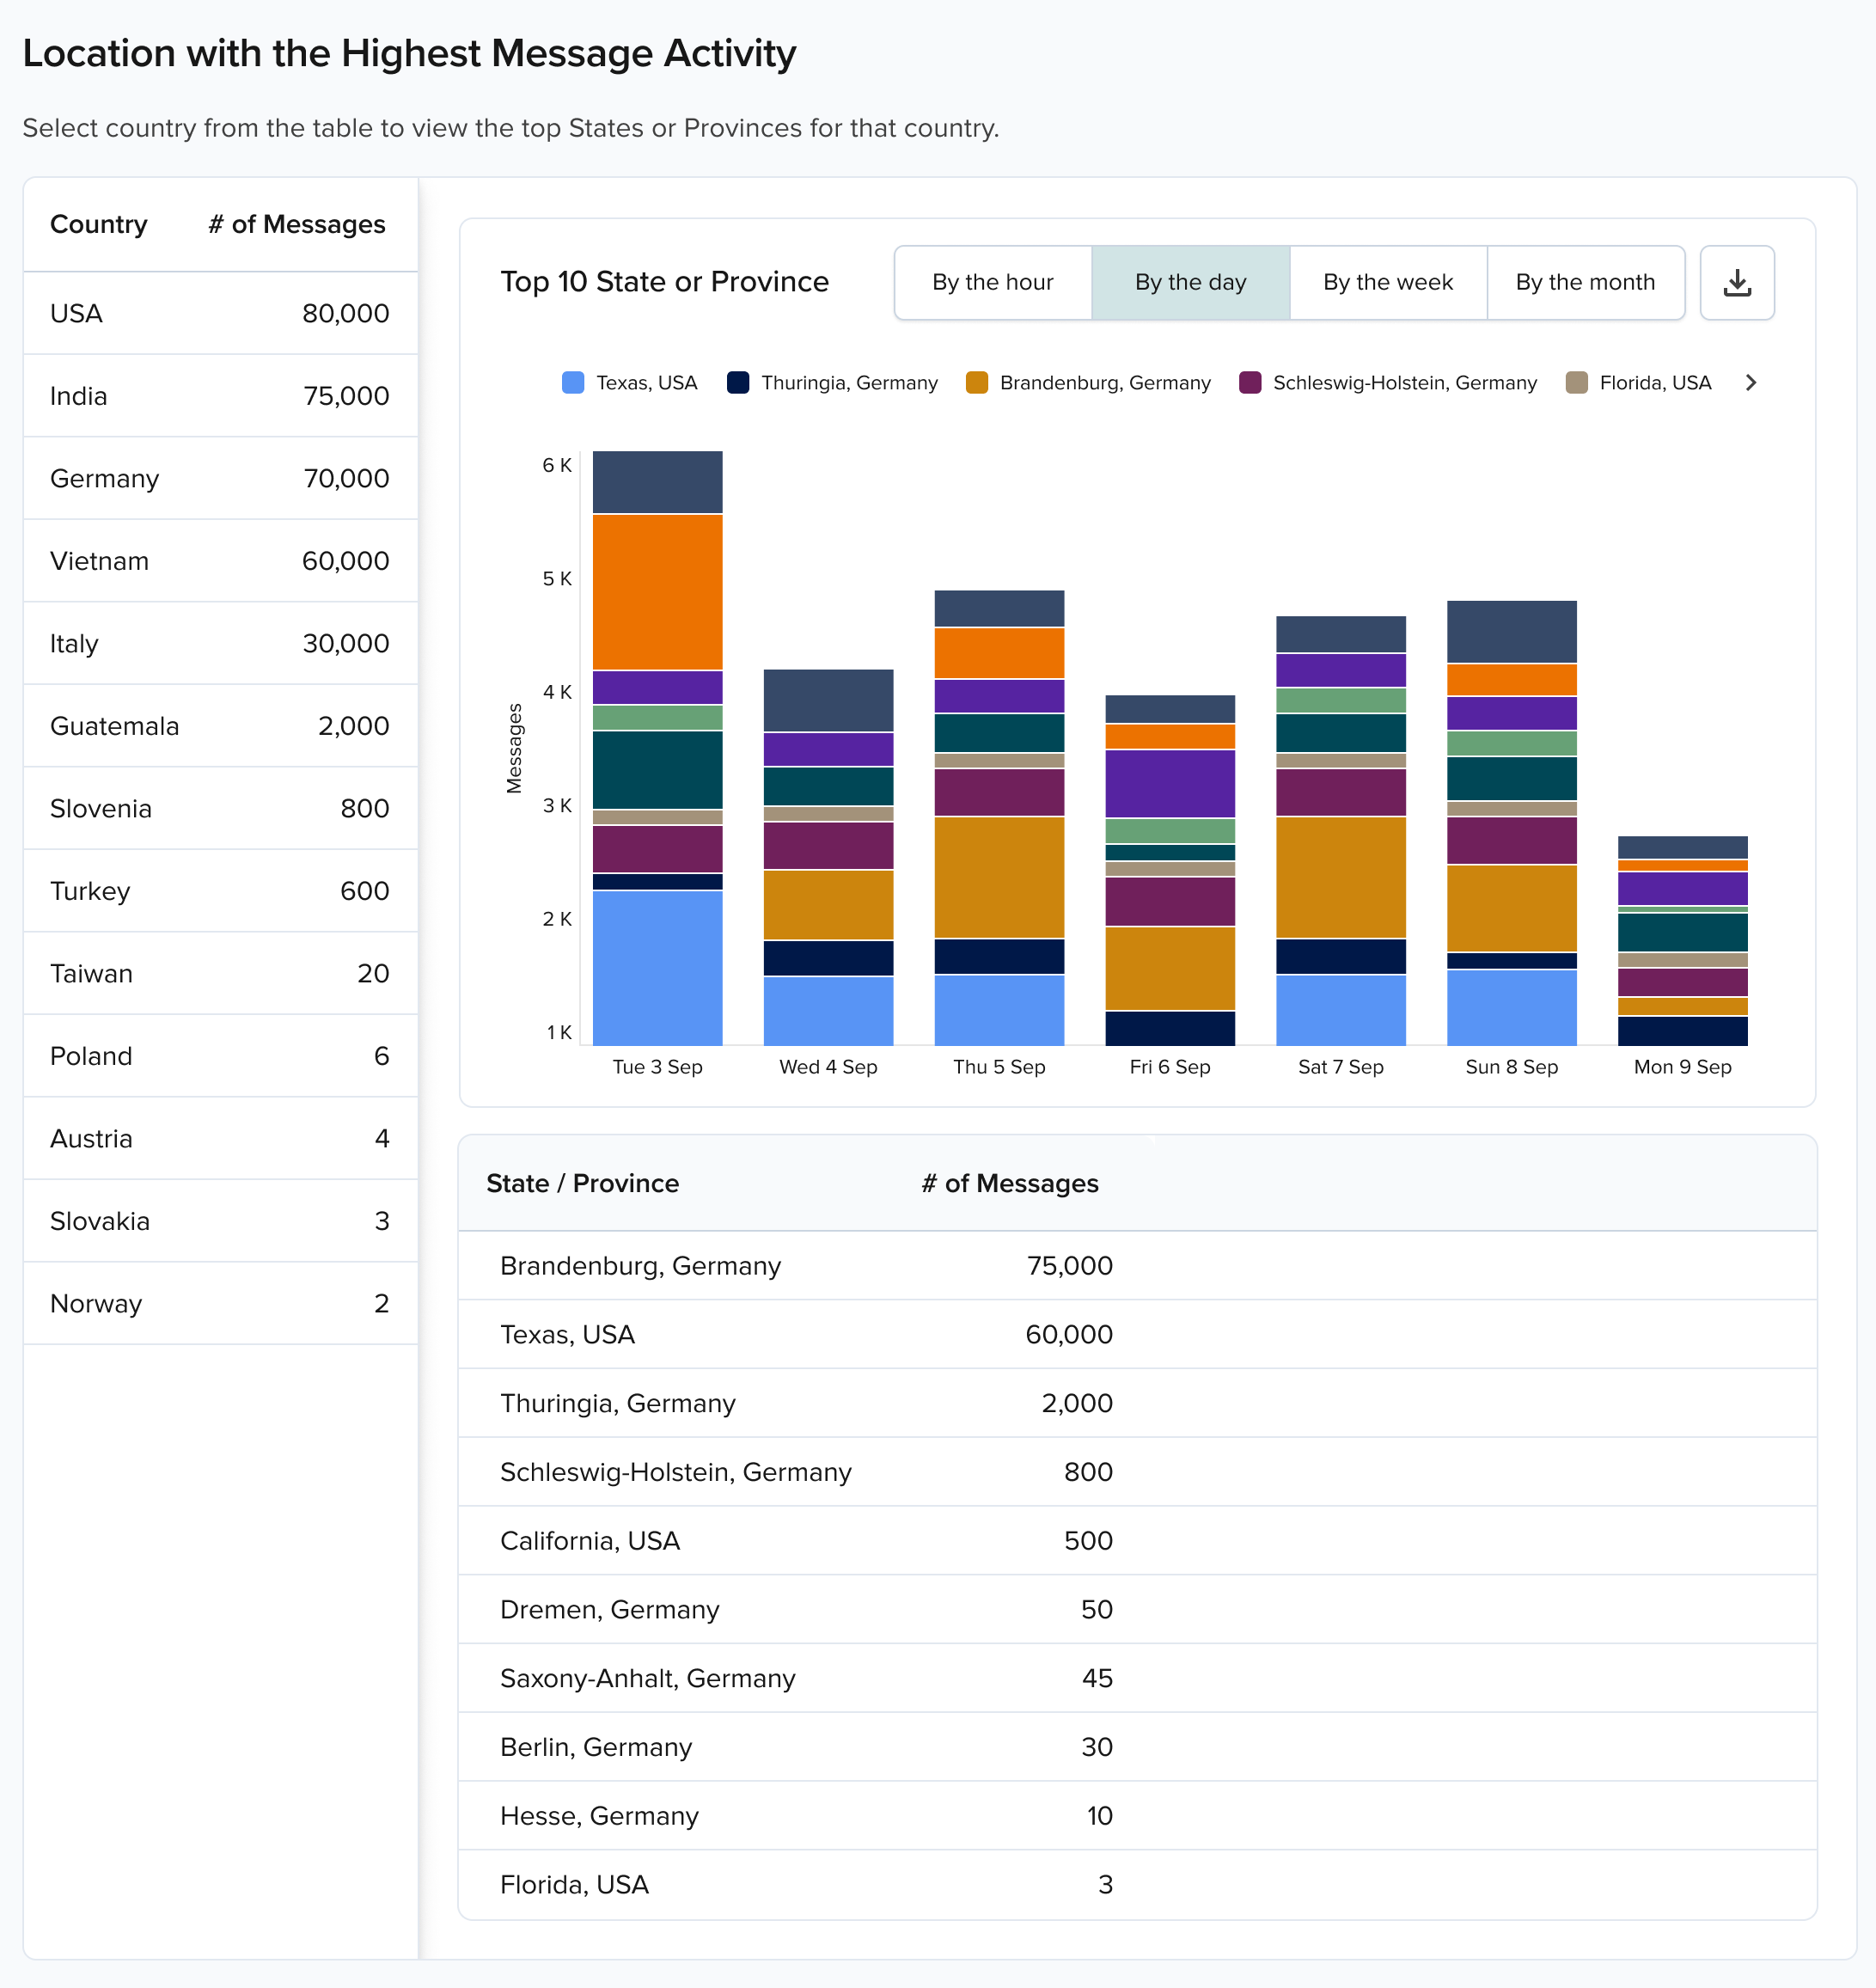
The Top 10 Message Types chart shows your top message types. If you follow PubNub's payload type conventions, the chart fills in automatically. If you do not, add a JSON path in Messages Configuration.
Message type conventions
If you use the recommended payload type conventions, message type and chat metrics fill in automatically.