Usage & Monitoring
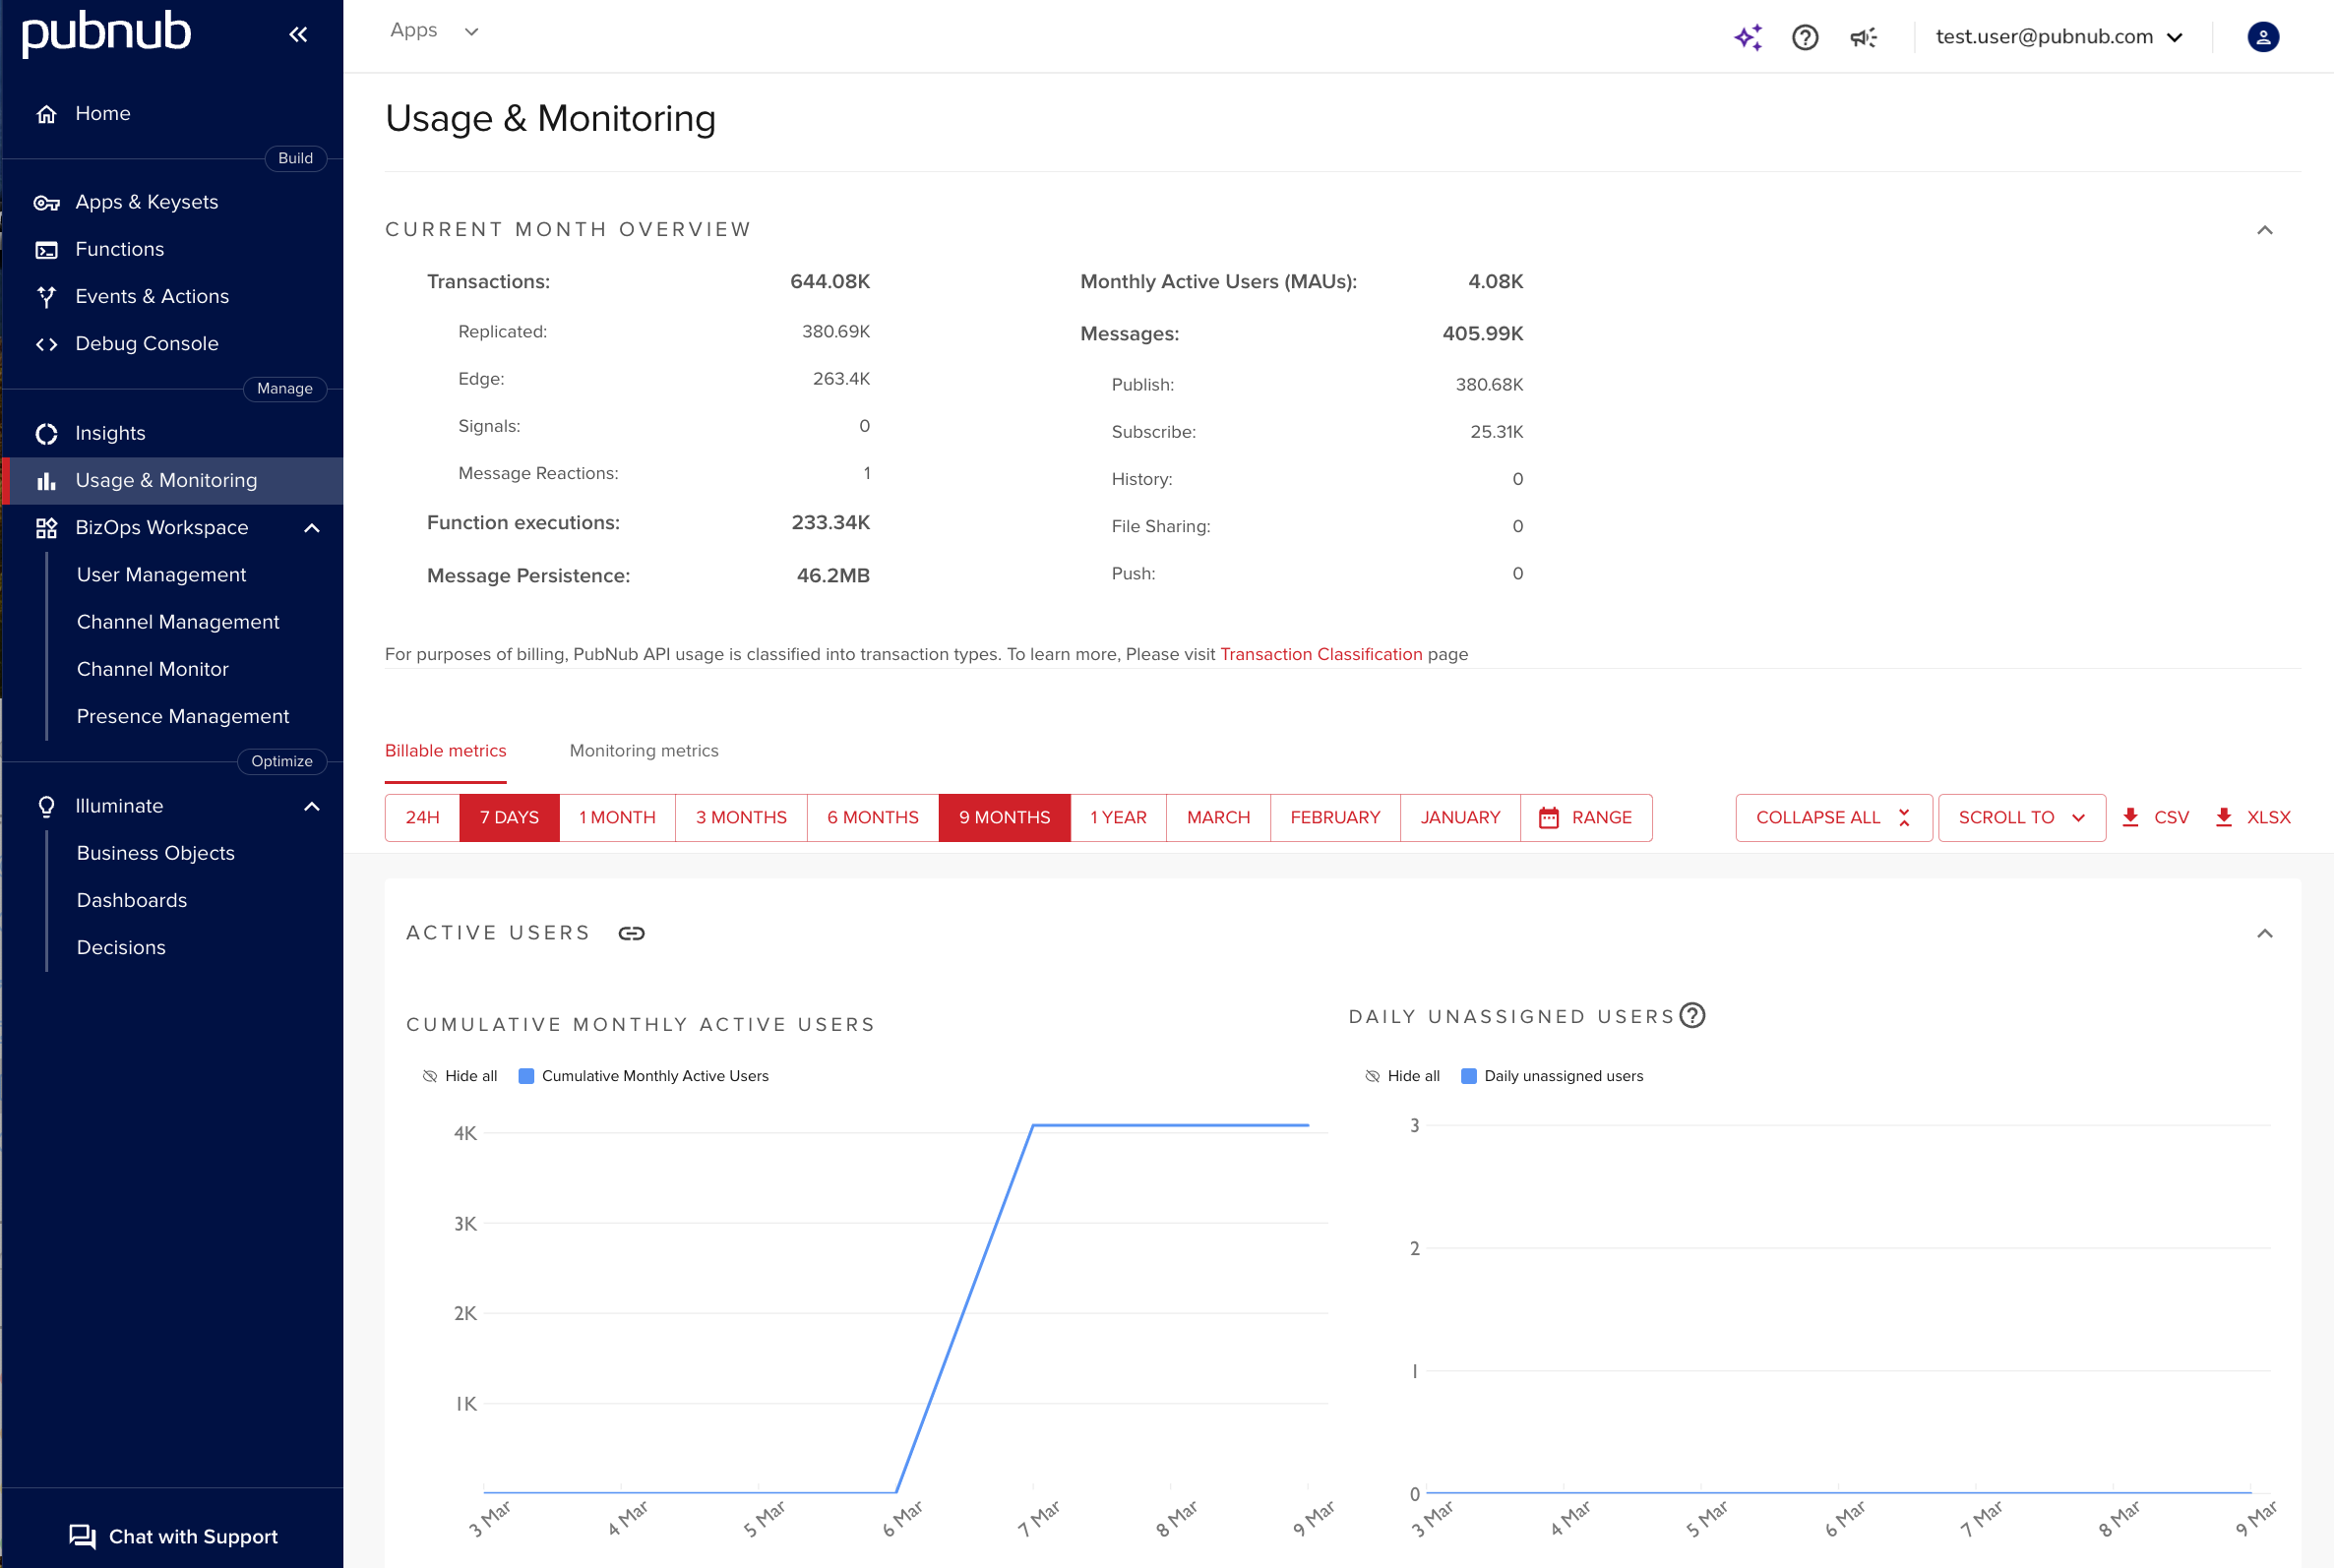
The Usage & Monitoring section shows both Billable and Monitoring metrics. You can view metrics for all apps or filter by a specific app and keyset.
Current month
This chart shows month‑to‑date statistics, split by:
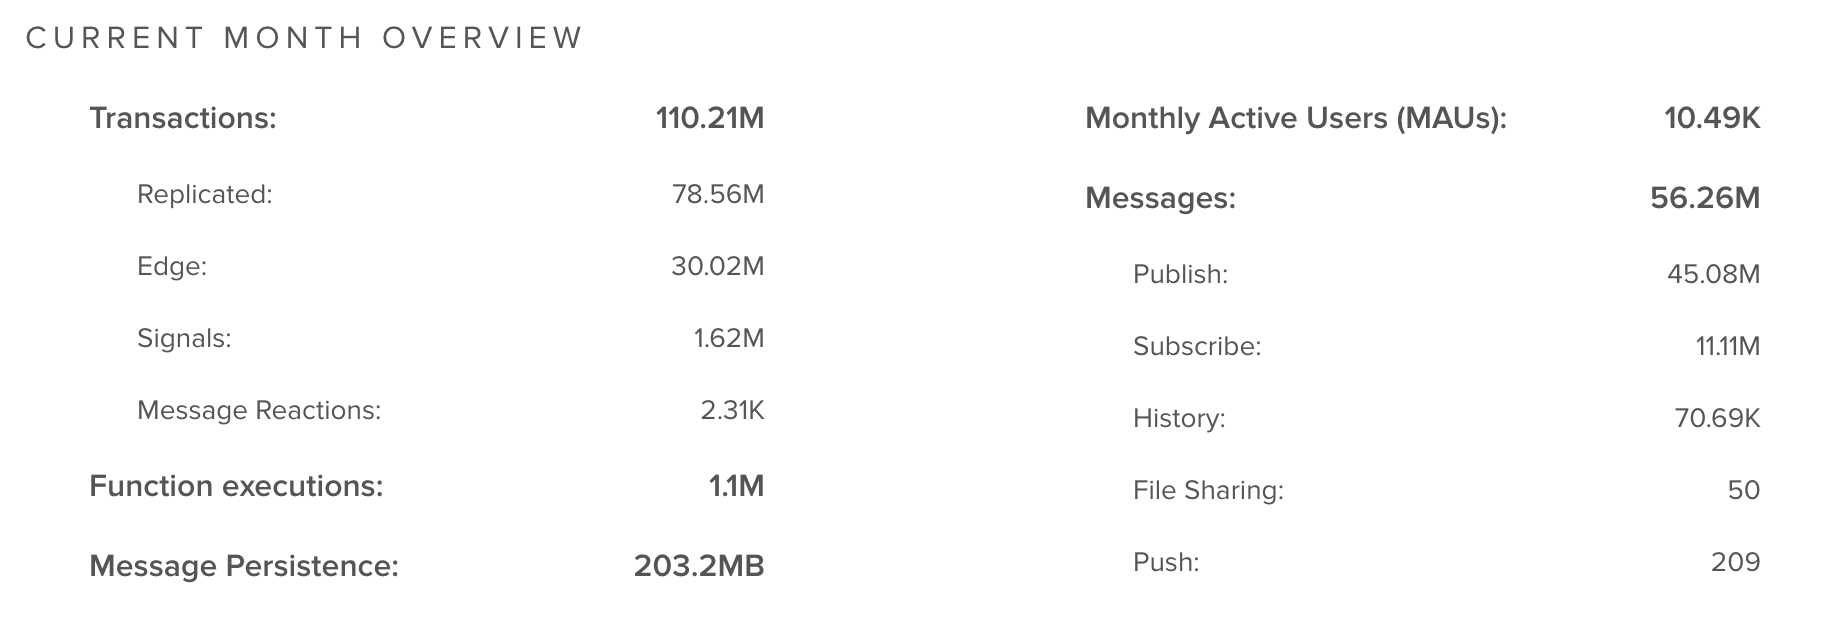
- Transactions
- Replicated
- Edge
- Signals
- Message Actions
- Functions Executions
- Message Persistence
- Monthly Active Users (MAU)
- Messages
You can also explore other timeframes in charts, including 24 hours, 7 days, 1–9 months, and a custom range with specific dates.
Metrics retention time
Free accounts keep most metrics for up to 90 days. For paid accounts, retention is up to 6 months (Starter) or 12 months (Pro). Selecting a longer time range may display 0 for out‑of‑range periods.
Download usage data
You can export data to .xlsx or .csv for any timeframe except 24 hours. Select the app, keyset, and timeframe, then click CSV or XLSX to download.
Export scope
If you do not select an app or a keyset, the report includes data from all apps and keysets.