Monitoring Metrics
The Monitoring Metrics tab shows charts that help you monitor your app at a glance.
Filters and types
Click a transaction type to filter. Hover over a type to see a tooltip.
Publish/Subscribe correlations
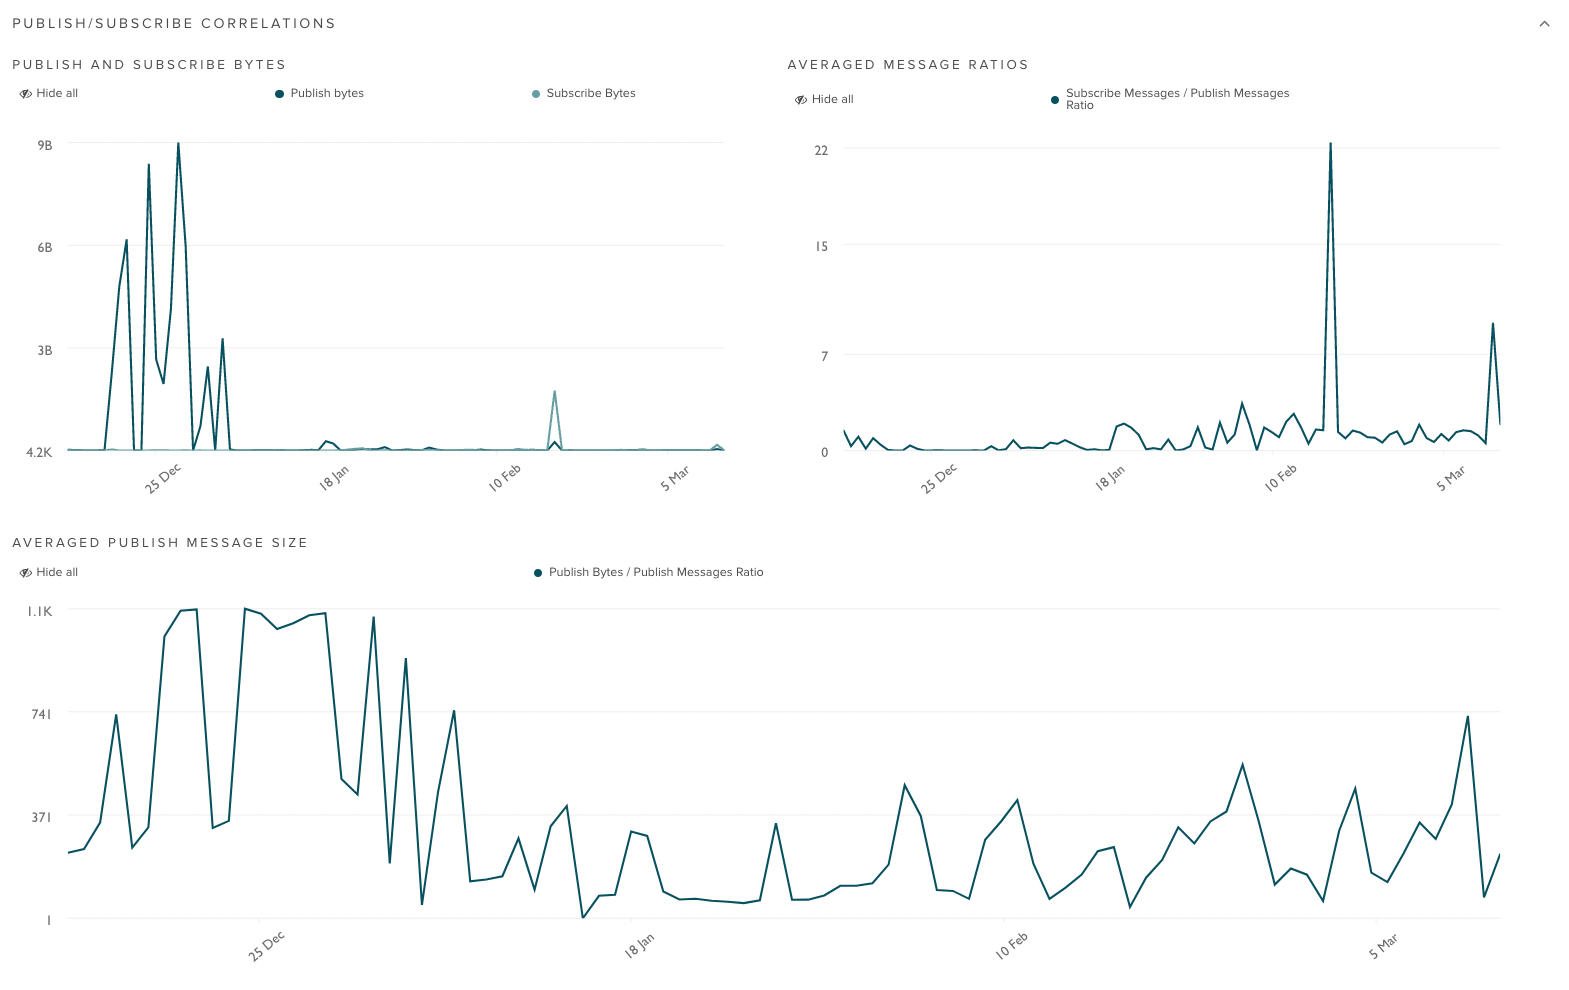
Shows the total number of Transactions for the Publish/Subscribe API over the selected time range.
Client errors
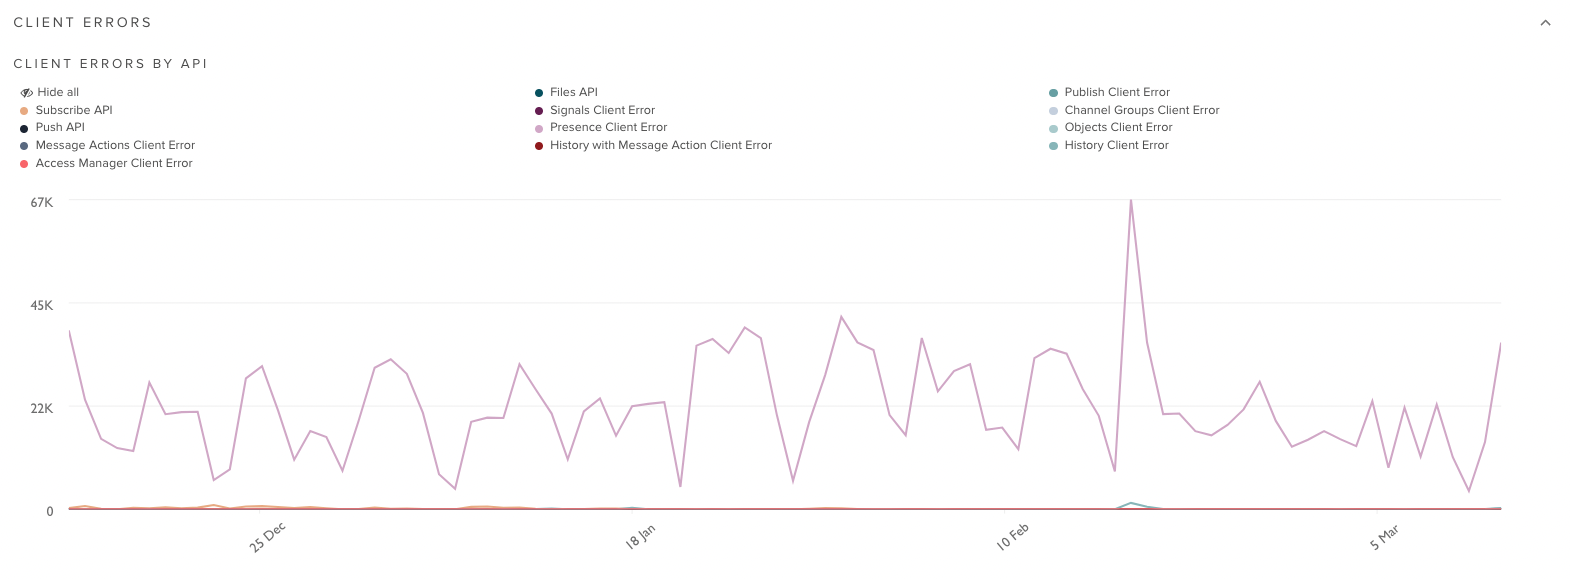
Shows the total number of client errors grouped by API over the selected time range.
Unauthorized Access
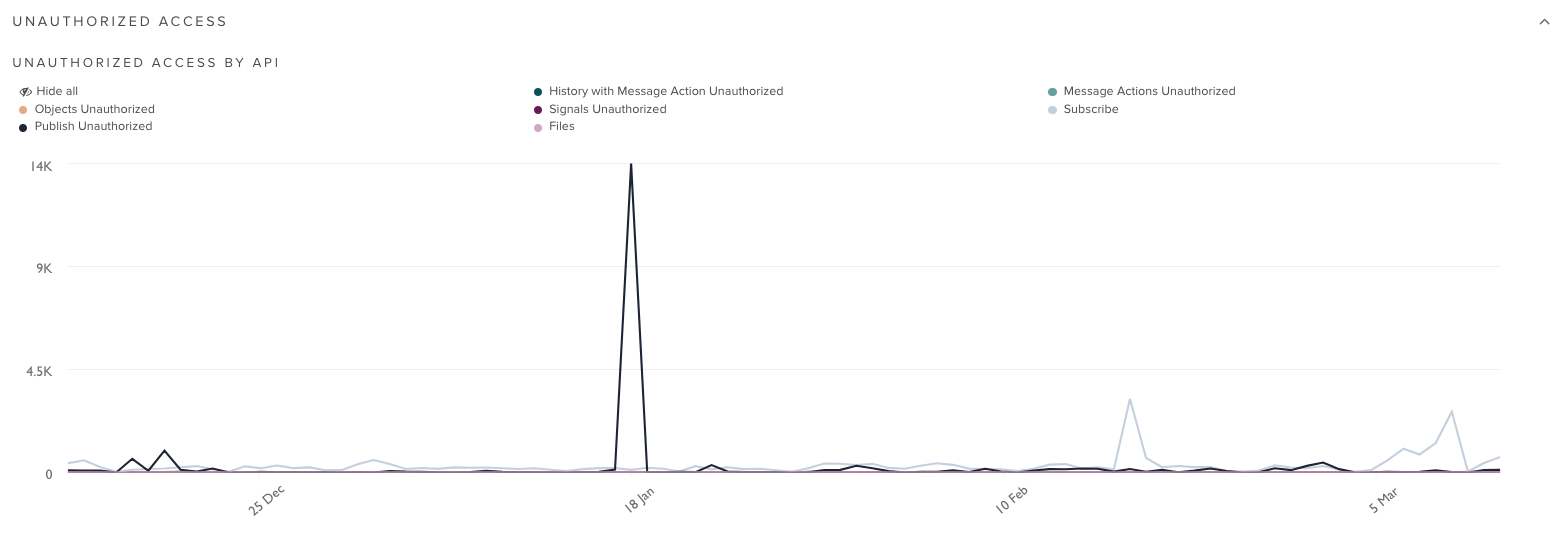
Shows the total number of unauthorized access attempts grouped by API over the selected time range.
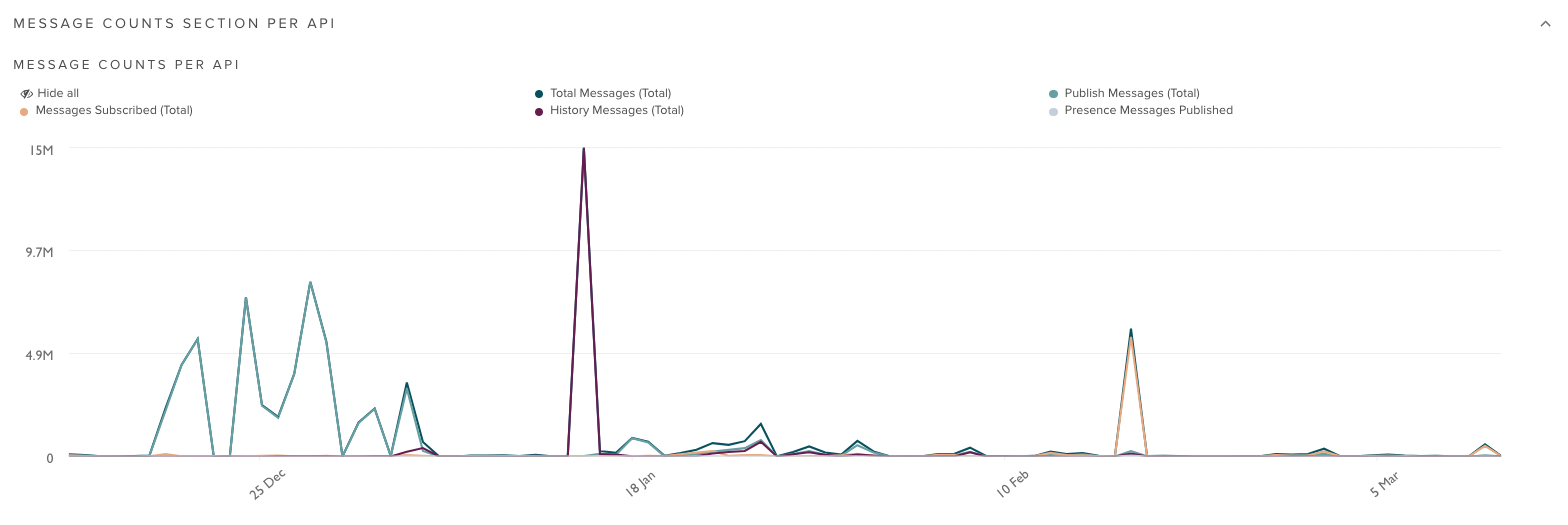
Message counts section per API
Shows the number of messages grouped by API over the selected time range.
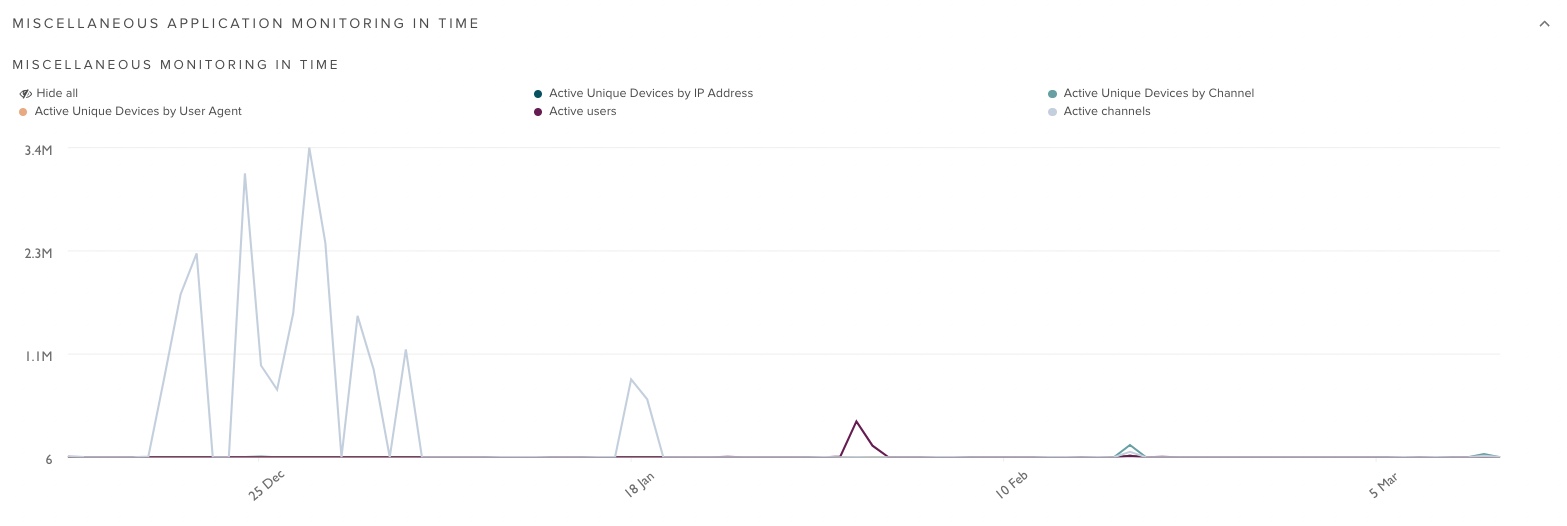
Miscellaneous application monitoring in time
Shows total activity over the selected time range.
Fire transactions
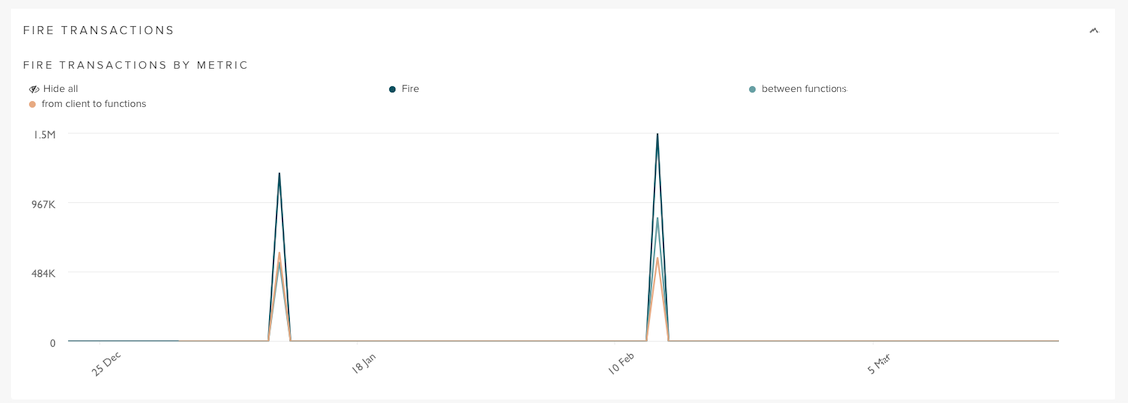
Shows the total number of Fire transactions grouped by metric over the selected time range.
