Create dashboards and charts
Visualize your app's data through Dashboards and charts to see key metrics at a glance.
Prerequisites
To create a chart, you need a Business Object and a metric.
Creating Dashboards for customers
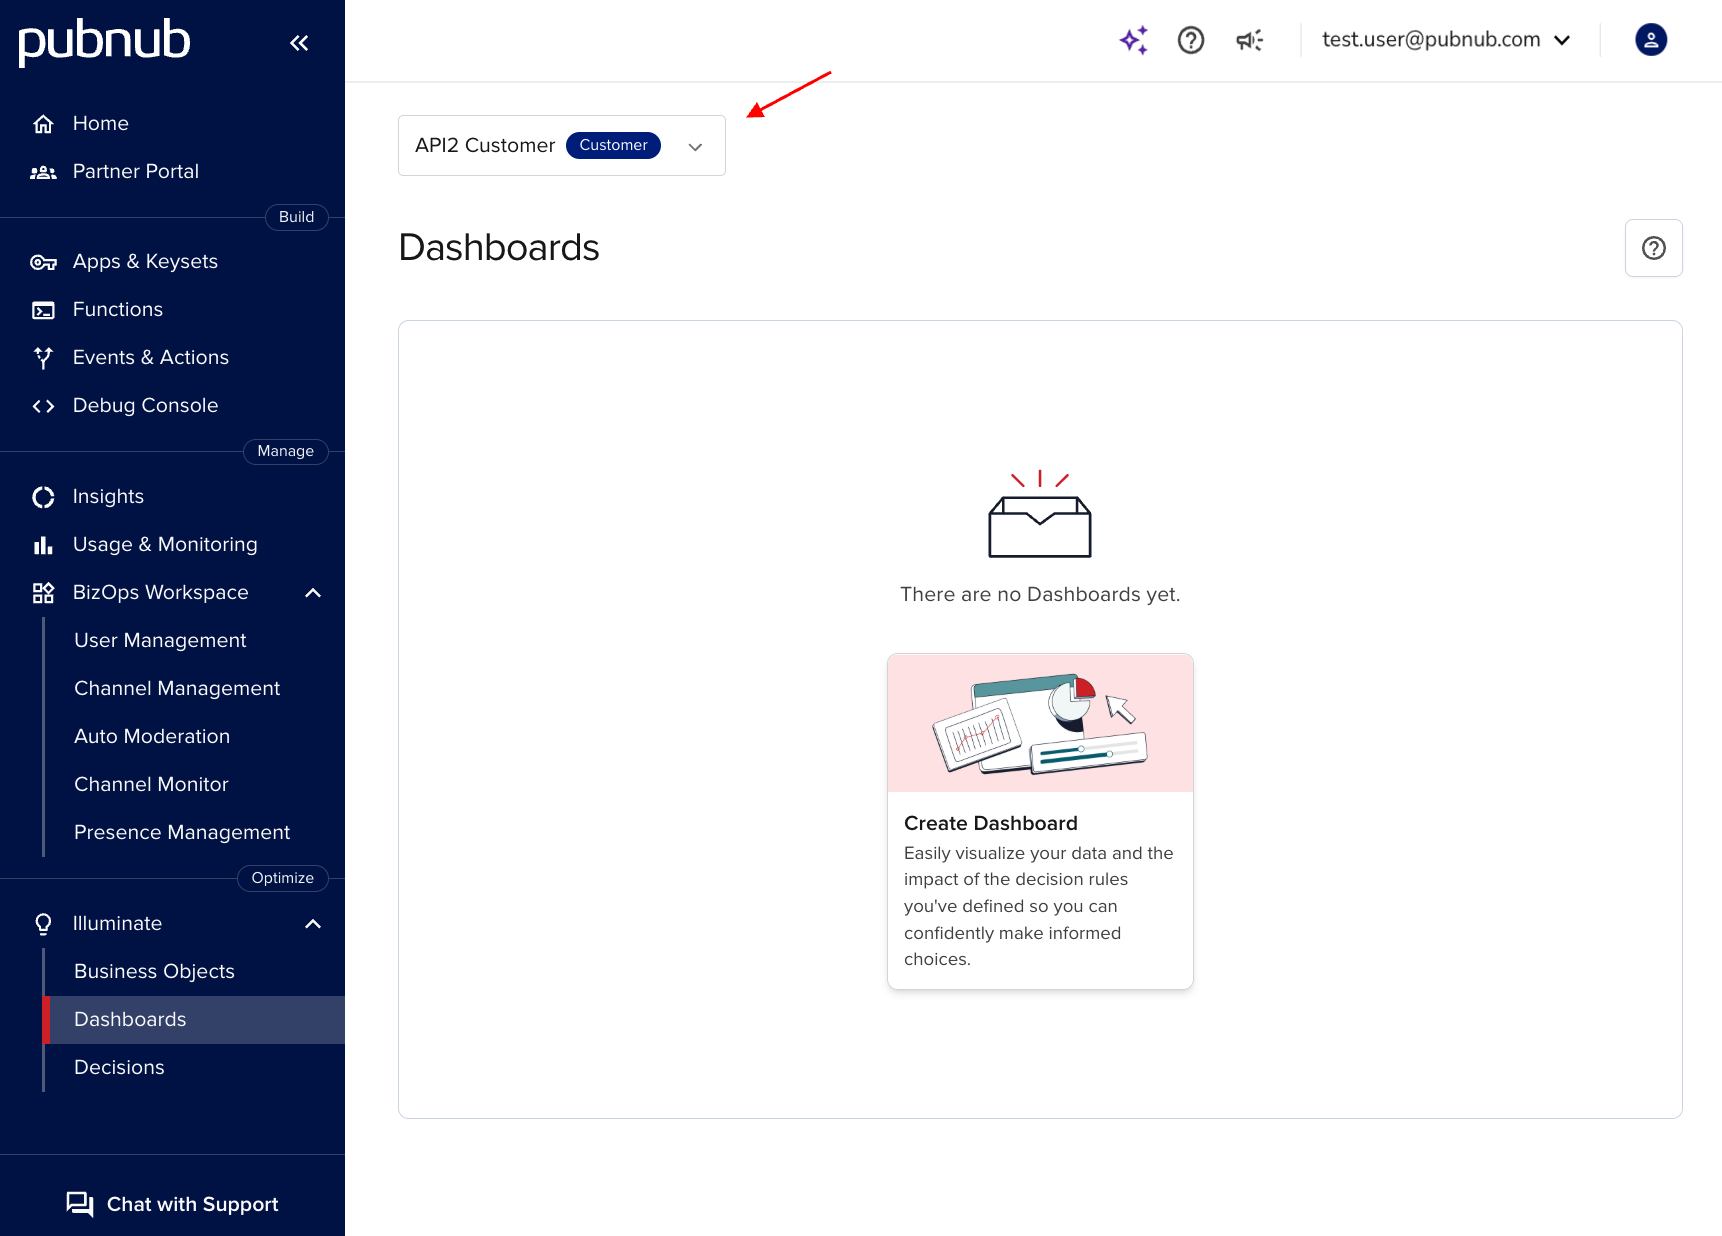
If you are a PubNub partner with Illuminate embedded in your website, you can create Dashboards for yourself or your end customers in the Illuminate section of the Admin Portal. Read Illuminate for PubNub Partners for details.
Use case
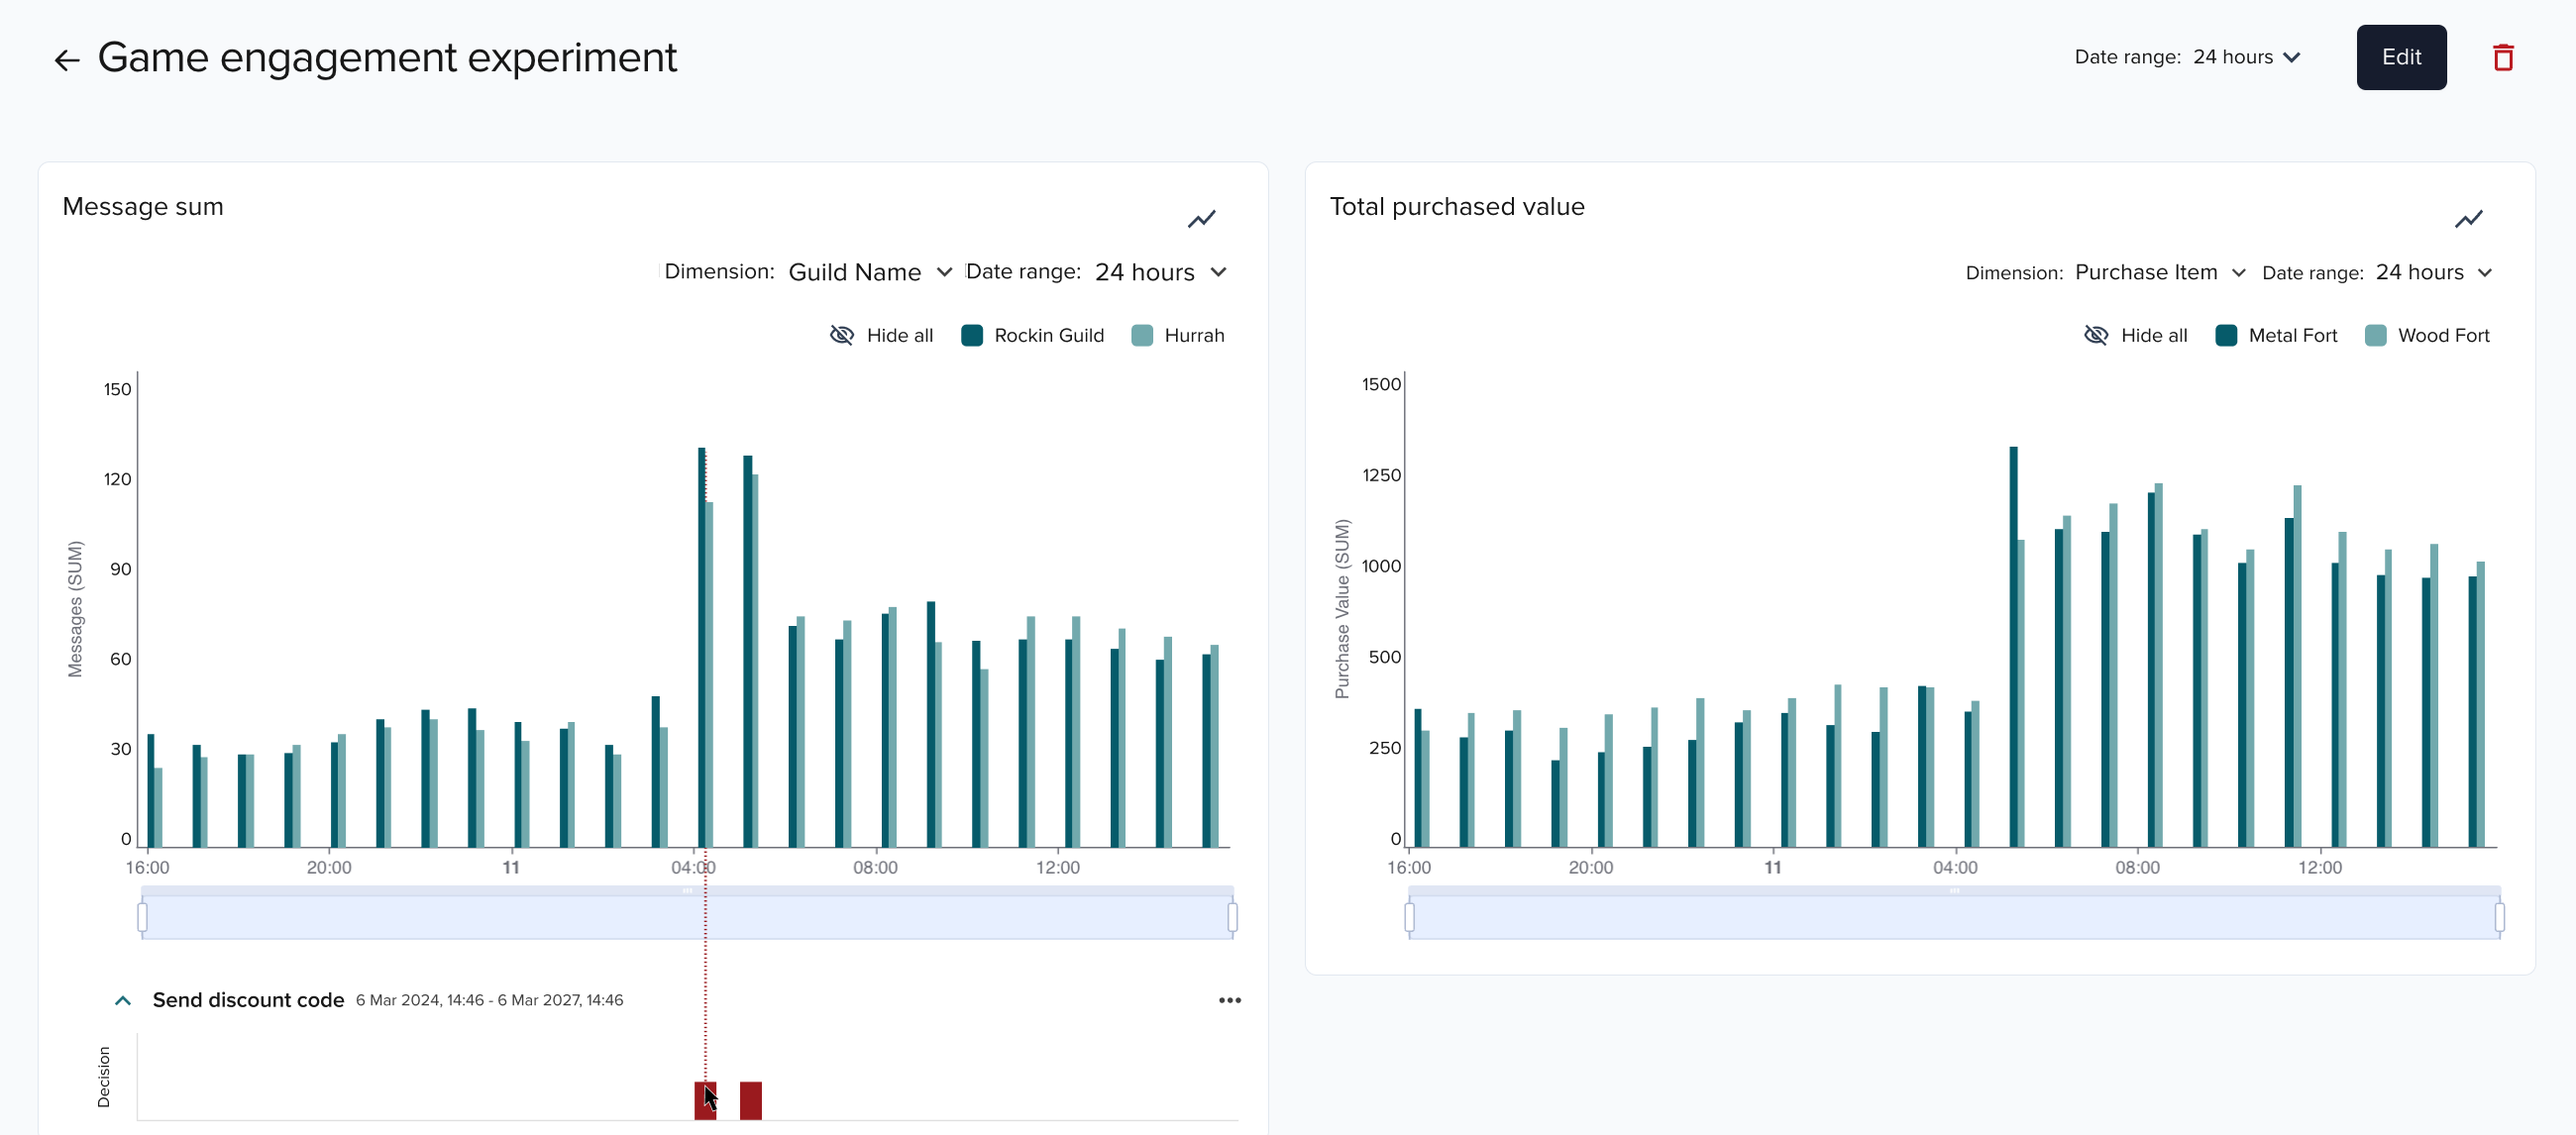
For our use case, create a Dashboard with two charts based on the previously created and activated Game engagement experiment Business Object and its metrics.
Check configuration details
Steps
First, create a Dashboard and then create charts to visualize your metrics.
- Watch video
- Step-by-step guide
-
On the Dashboards home page, click Create Dashboard and enter the Dashboard name (
Game engagement experiment). -
Either Save the Dashboard now and Edit it to add a chart, or add a chart first and Save at the end.
-
From the Dashboard view, click Add Chart to open the configuration modal.
-
Click Select Business Object and choose the
Game engagement experimentBusiness Object. -
Choose the
Message summetric. The chart auto‑populates with the metric configuration.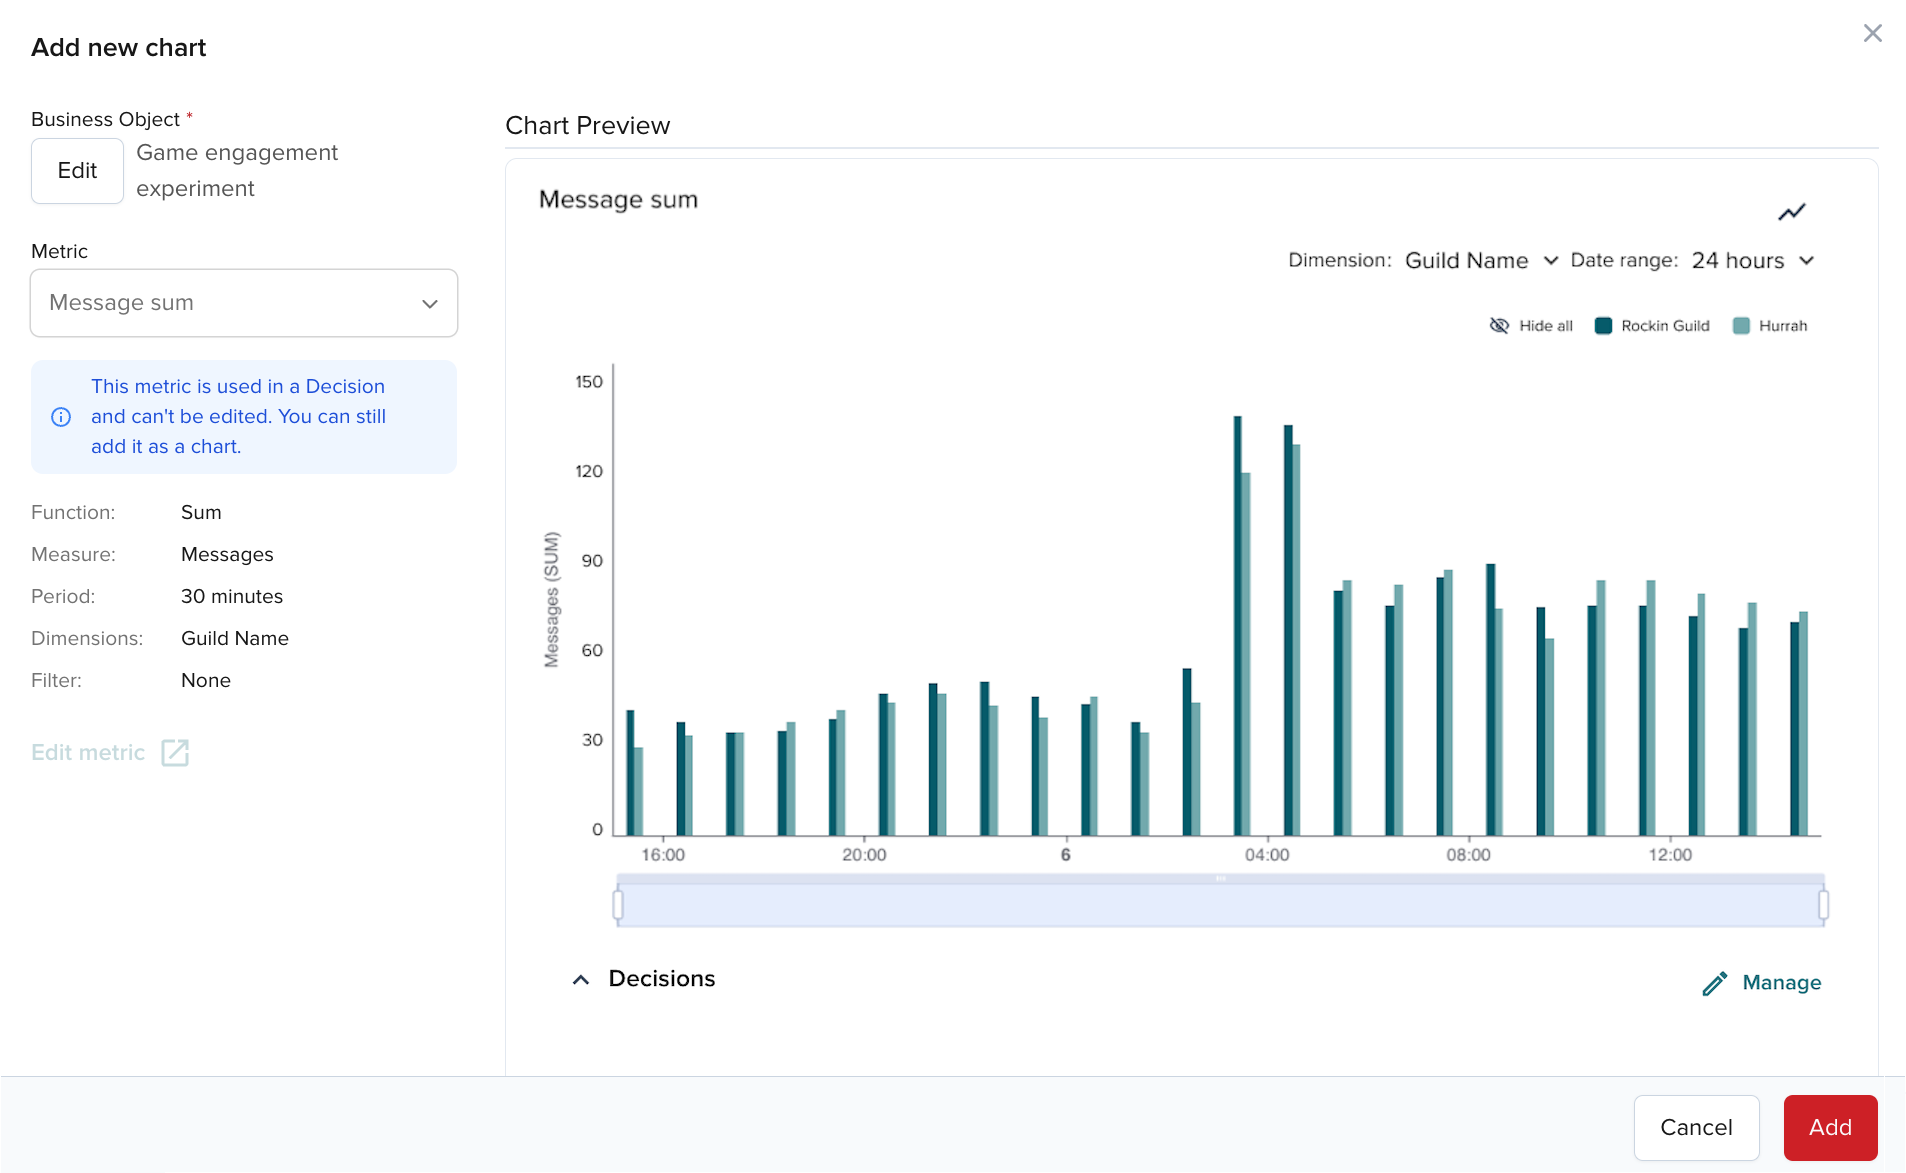
-
If needed, add a Decision to visualize with the chart by clicking Manage.
-
Click Add to save the configured chart.
The chart name is generated from the metric name.
-
Create another chart for the
Total purchased valuemetric and Add it to the Dashboard.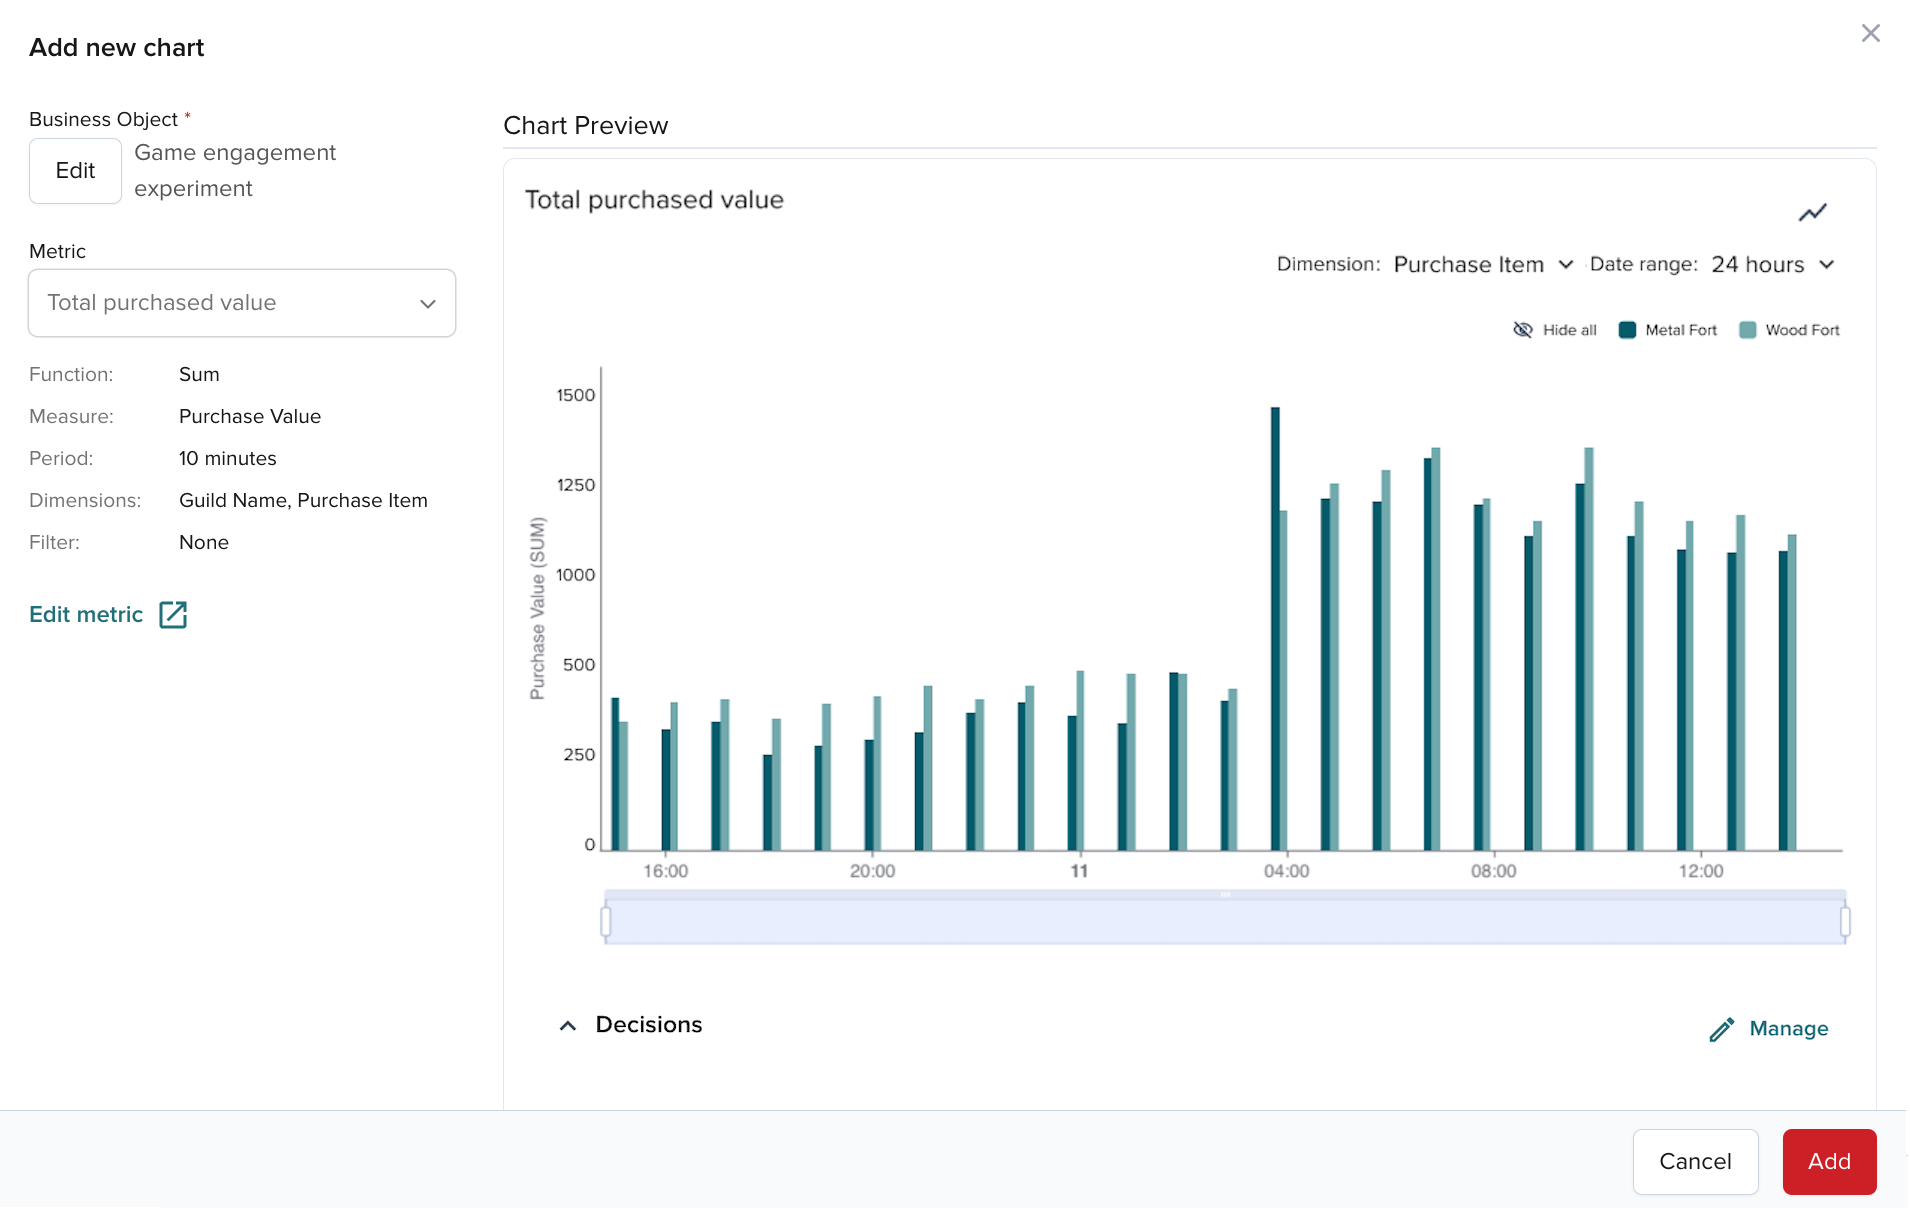
-
Save the Dashboard if you didn’t save it earlier. To add more charts, click Edit and add charts.
You can now watch data as it arrives. See when actions trigger at the 100 messages threshold and how that impacts total purchased value.
Illuminate for PubNub partners
If you’re a PubNub partner, you’ll see a drop‑down menu to choose who you’re working on Illuminate for.
- Select your own company name at the top of the drop-down if you’re creating Dashboards for yourself.
- All customers to see which customers have been set up with Illuminate.
- A customer name to see only their Dashboards and start creating or editing only for this one customer.
- All internal and customers for your own Dashboards and those of the customers.
Depending on what you’ve selected from the partner drop-down menu, you’ll see a Customer column that provides information on who a Dashboard belongs to – a customer or your own organization.
- If you don’t see a customer in the drop-down menu, go to the Partner Portal section of the PubNub Admin Portal and make sure you’ve created the customer in PubNub and assigned a keyset to them.
- If, after selecting the customer, you don’t see apps or keysets for selection, assign keysets for this customer in the Partner Portal.