PubNub Illuminate
PubNub Illuminate is a real-time decision and analytics product. Customize it to your use case.
Use Illuminate to:
- Define custom real-time aggregated metrics.
- Set up and deploy decision rules with conditions and actions.
- See your metrics, the actions taken, and results.
Availability
Illuminate works with any real-time app. Start with a two‑week free trial and, after two weeks, contact sales to upgrade.
If you use another platform, send data with the PubNub Fire API.
Access
Open the Admin Portal. In the sidebar, click Illuminate > Dashboards, Business Objects, or Decisions. These options map to the core modules in your real‑time workflow.
Public Admin Portal demo
Want to browse through the Admin Portal without creating an account? Explore it through the Public Demo that shows examples of most PubNub features for transport and logistics use case.
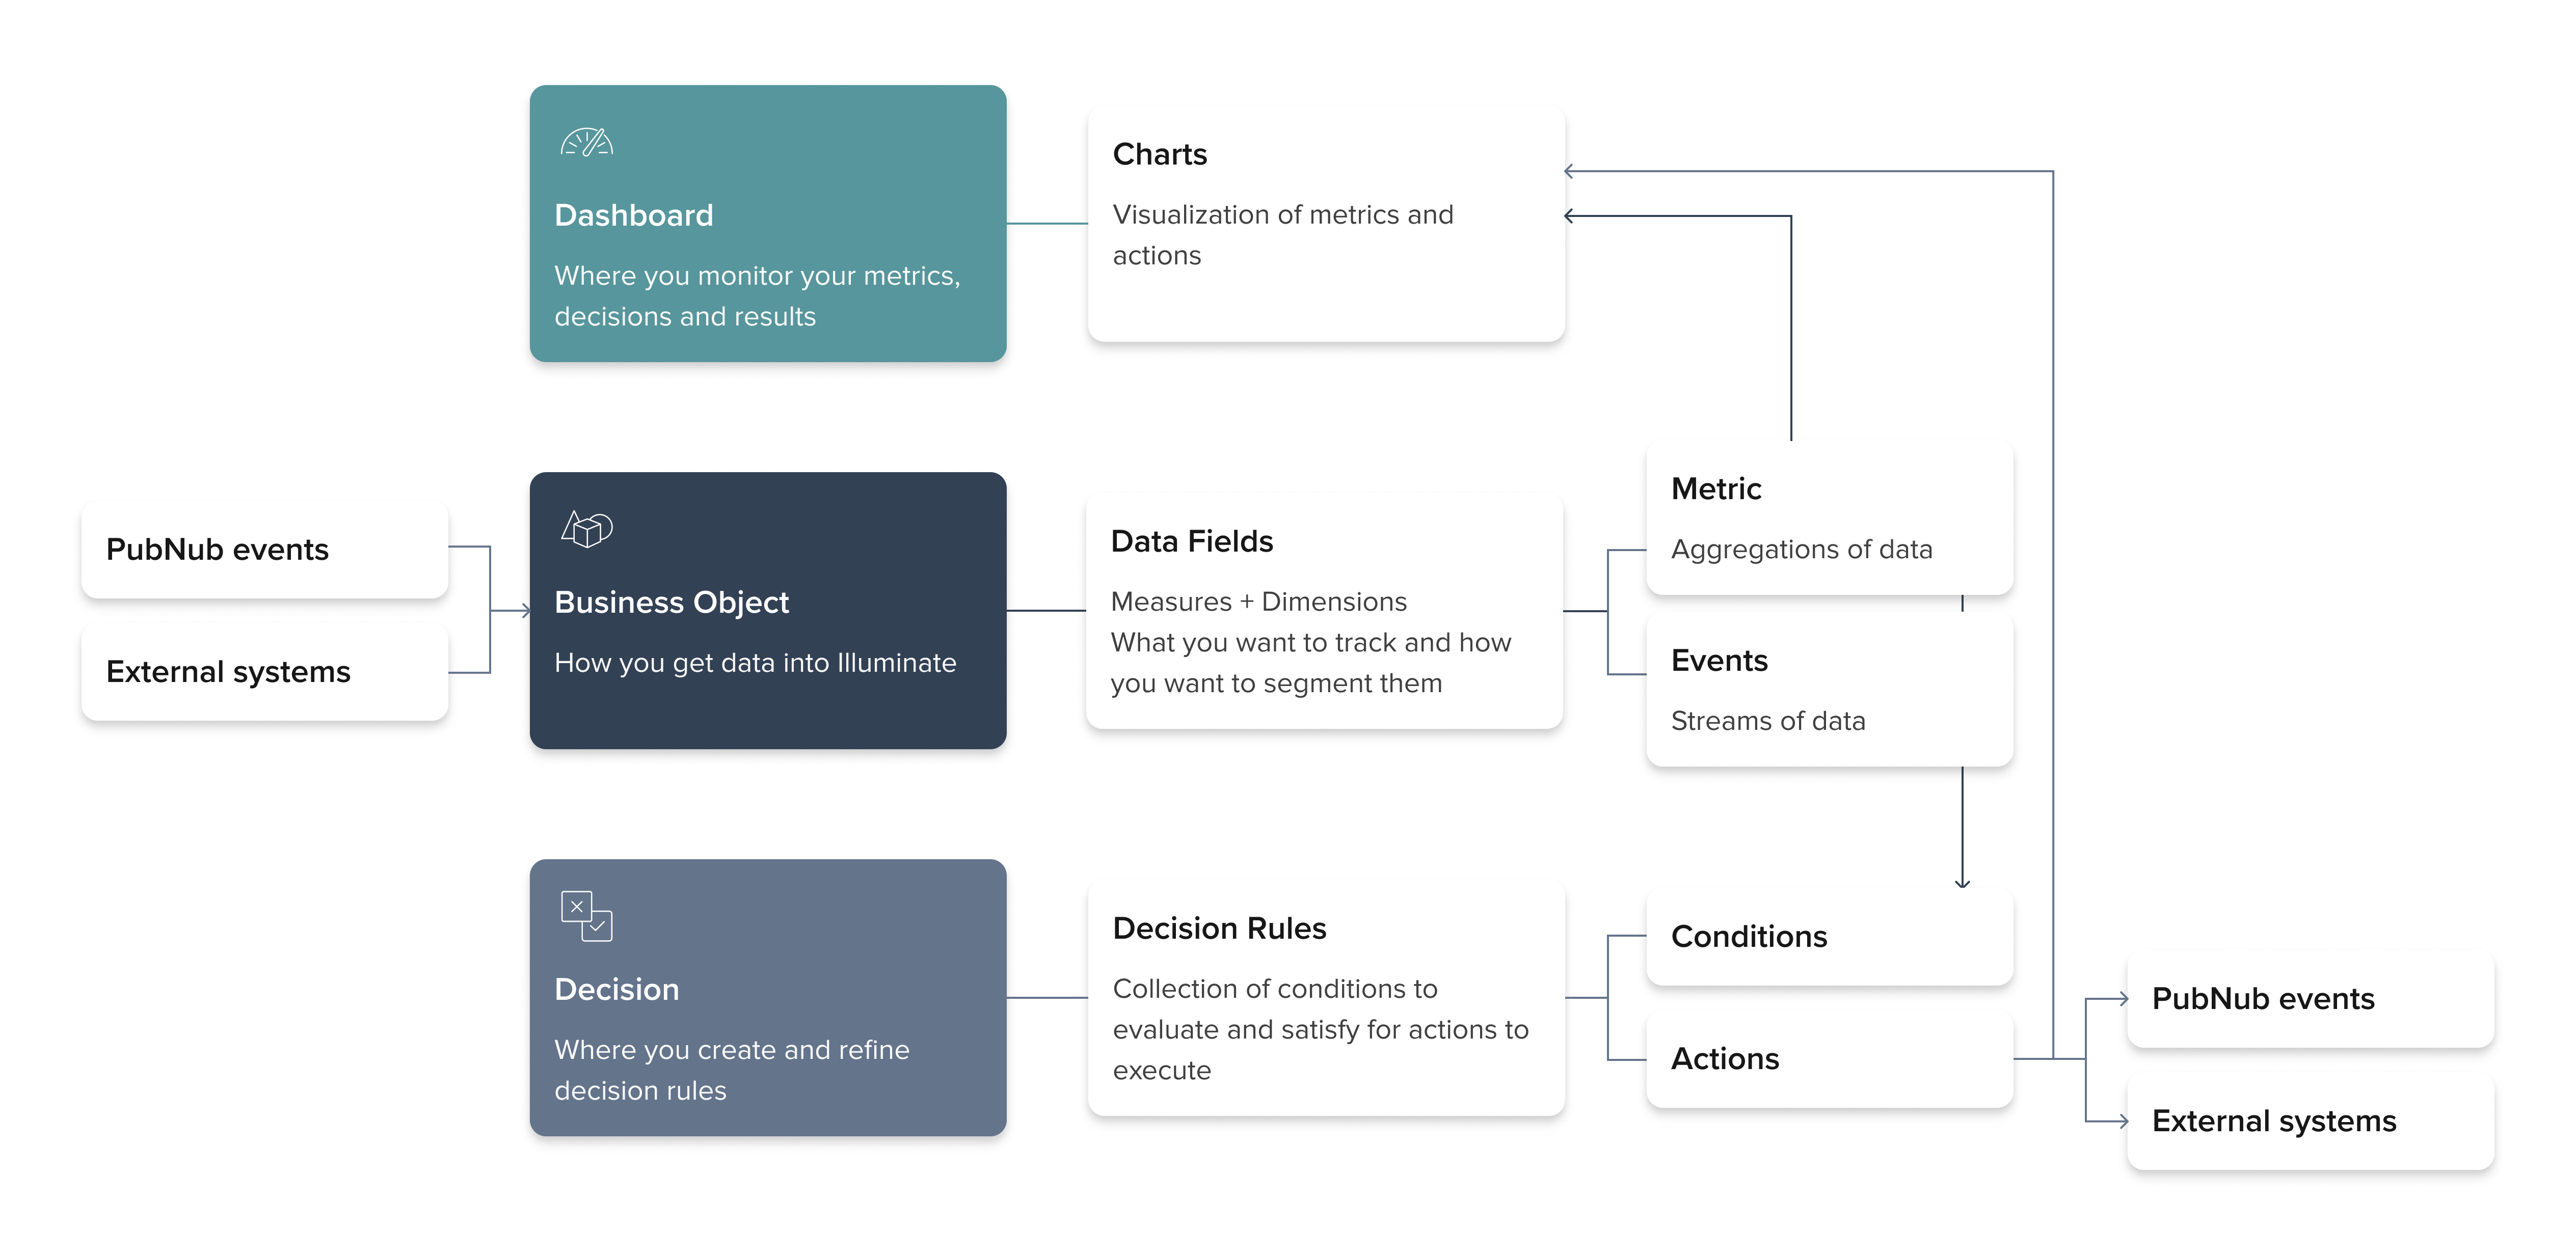
Building blocks
Illuminate consists of these three modules:
- Business Object – Capture data into Illuminate. A Business Object ingests from selected apps and keysets. Define data fields and create metrics that feed Decision rules and Dashboard charts. Activate it to start capture.
- Decision – Turn metrics into action. Define rules with conditions and actions. Decisions evaluate metrics in real time and run the action when a rule is met.
- Dashboard – Visualize outcomes and trends. A Dashboard renders charts using metrics from Business Objects and actions from Decisions. Track performance in real time.
Get started
Start with Business Objects to define and capture data. Then create Decisions to act on metrics. Finally, build Dashboards to monitor results.
Who uses Illuminate
Illuminate is meant to serve three types of personas, although all actions can be performed by one person or a few collaborating asynchronously:
- Users who are responsible for growth and revenue. They need to understand what's happening in real time, make decisions based on the data they see, and execute them. Usually, they are Growth or Product Managers, Product Strategy Managers, or Product Directors.
- Users who help others with data analysis and translate product data requirements into technical requirements for implementing data measuring points. Typically, they are Business Analysts, Data Scientists, or Business Intelligence Engineers.
- Users who implement product features and support the application's technical development. Usually, they are Software Engineers, Tech Leads, or Technical Directors.
Sample use case
Illuminate helps you make data‑backed decisions across industries and use cases.
Examples:
- Multi-user collaboration (Gaming): Targeted monetization experiments
- Live audience engagement (Live events): Personalized recommendations, promotions, or rewards
- Data streaming (Transport, delivery, and logistics): Asset tracking
- Device control (IoT): Alerts and warnings
This guide uses a gaming scenario with two competing guilds.
Run an experiment: send discounts to engaged guilds (based on message volume). Measure if discounts lift revenue and item sales.
For this scenario, we will set up the following:
- Business Object that collects the data to measure. Create metrics that aggregate data for visualizations and decisions. Capture guild name, sent message, purchase item, and purchase value as data fields. Create two metrics: total messages per guild and total purchased item value.
- Decision that defines conditions to evaluate and actions to take when conditions are met. For our scenario, we want to send a discount to a guild that sends 100 or more messages over 30 minutes.
- Dashboard to visualize metric data and triggered actions in real time.
Create a Dashboard with two charts.
- One chart shows message counts and discount triggers at the 100‑message threshold.
- Another chart shows revenue over time to compare discount impact.