About Dashboards
Illuminate lets you visualize metrics, decision actions, and results through charts on Dashboards.
You can observe trends in real time and refine your approach with data‑driven decisions.
Dashboards
A Dashboard is a collection of charts that shows your metrics in one place.
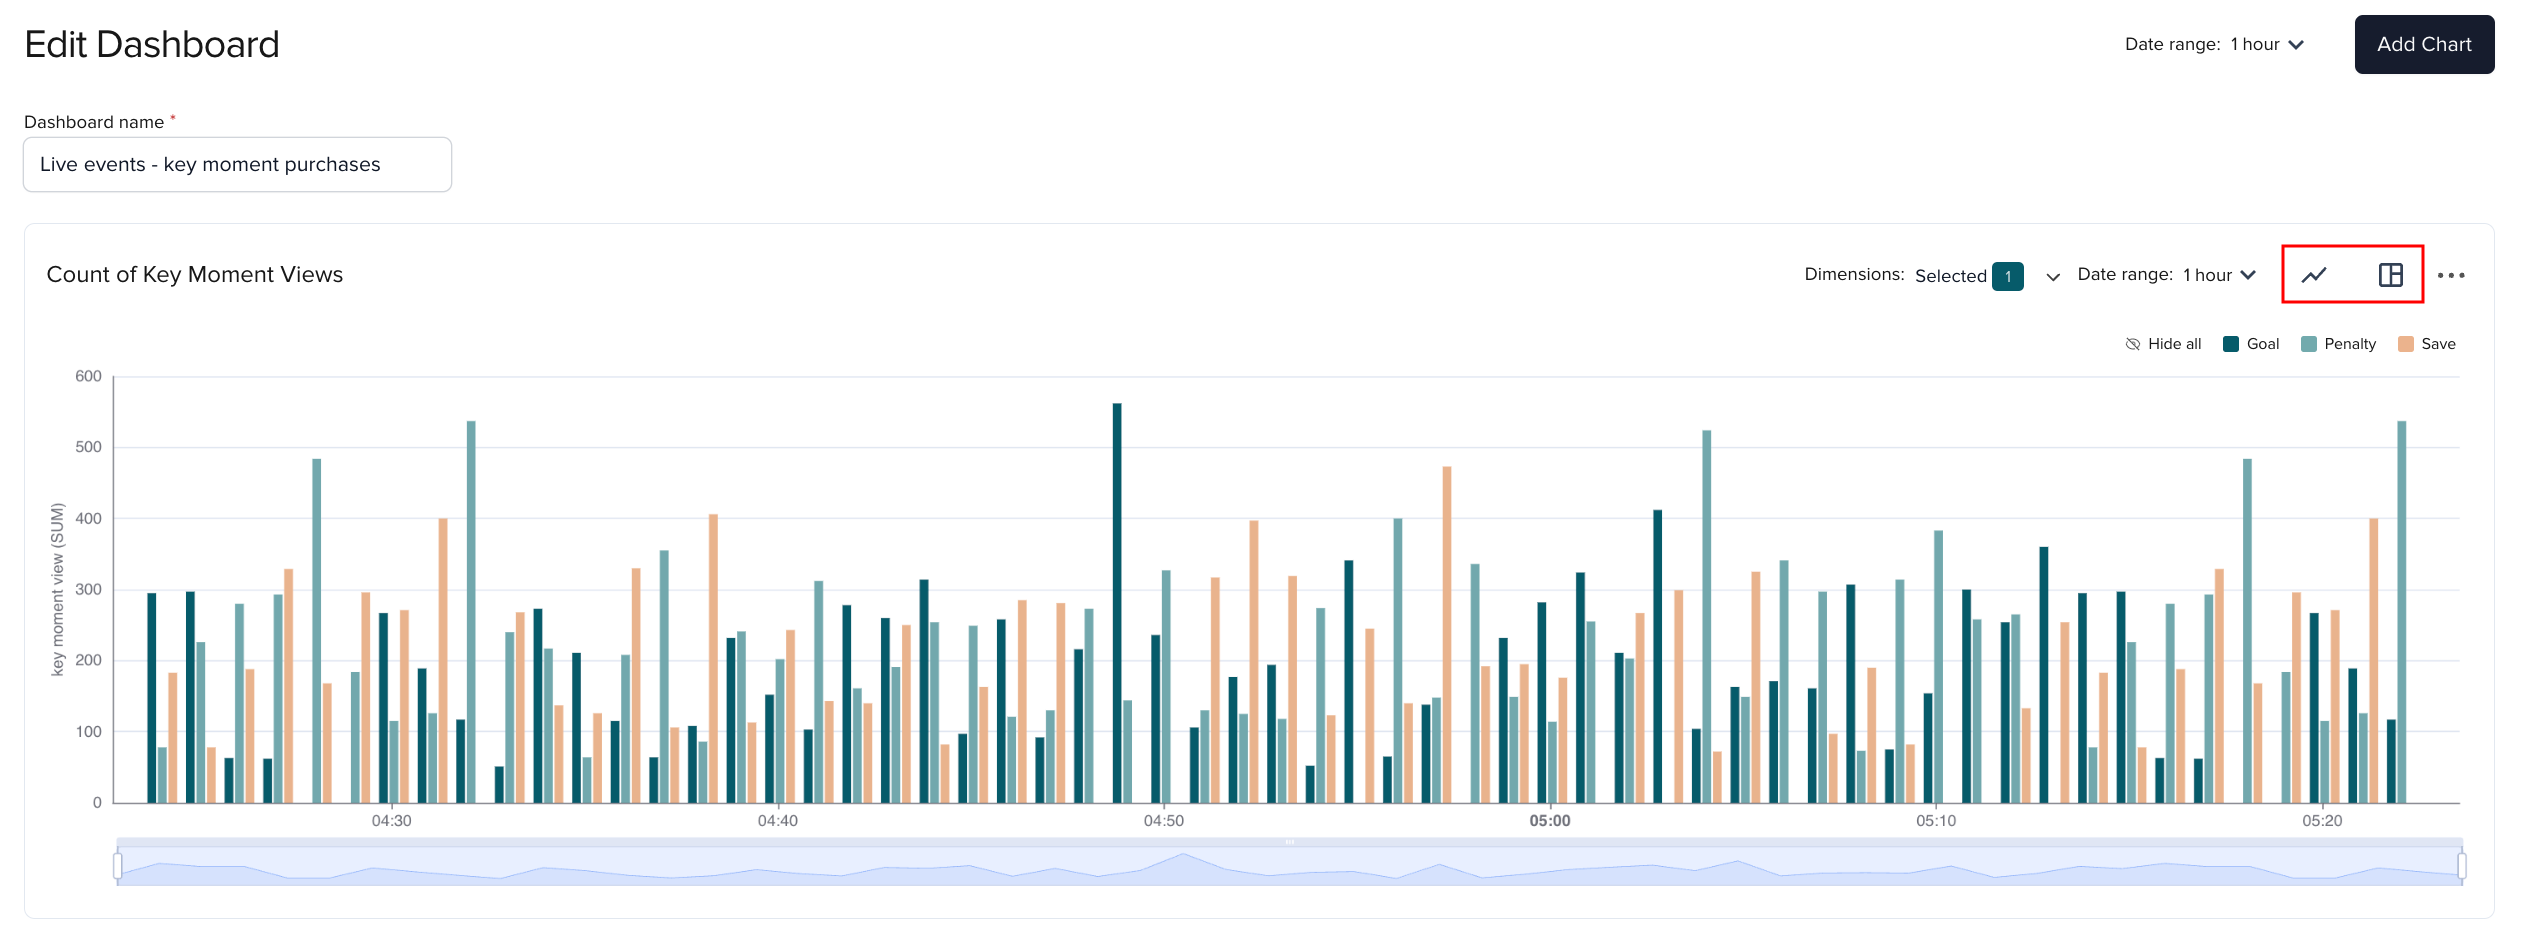
For example, create a Dashboard with charts for all "Key Moments" in a watch party, such as:
- Count of participants who viewed a Key Moment (goal, penalty, red card).
- Sum of advertised items purchased during Key Moments.
Data time zone
Data displayed on a chart is shown in your browser’s time zone.
To create a Dashboard and a chart, go to Dashboards under Illuminate in the Admin Portal. Read Create dashboards and charts for details.
Charts
A chart visualizes a metric for a Business Object. For example, show the sum of merchandise items (jerseys, scarves, hats) purchased during a Key Moment in a live event.
You can customize how metric data is displayed in a chart:
- Choose a time range (
30 minutes,1 hour, orCustom date). - Choose a chart type: bar (default), stacked bar, or line.
Prerequisites and dependencies
To work effectively with Dashboards, keep the following in mind:
- Create a Dashboard before you add charts.
- To create a chart, first create a Business Object and add a metric.
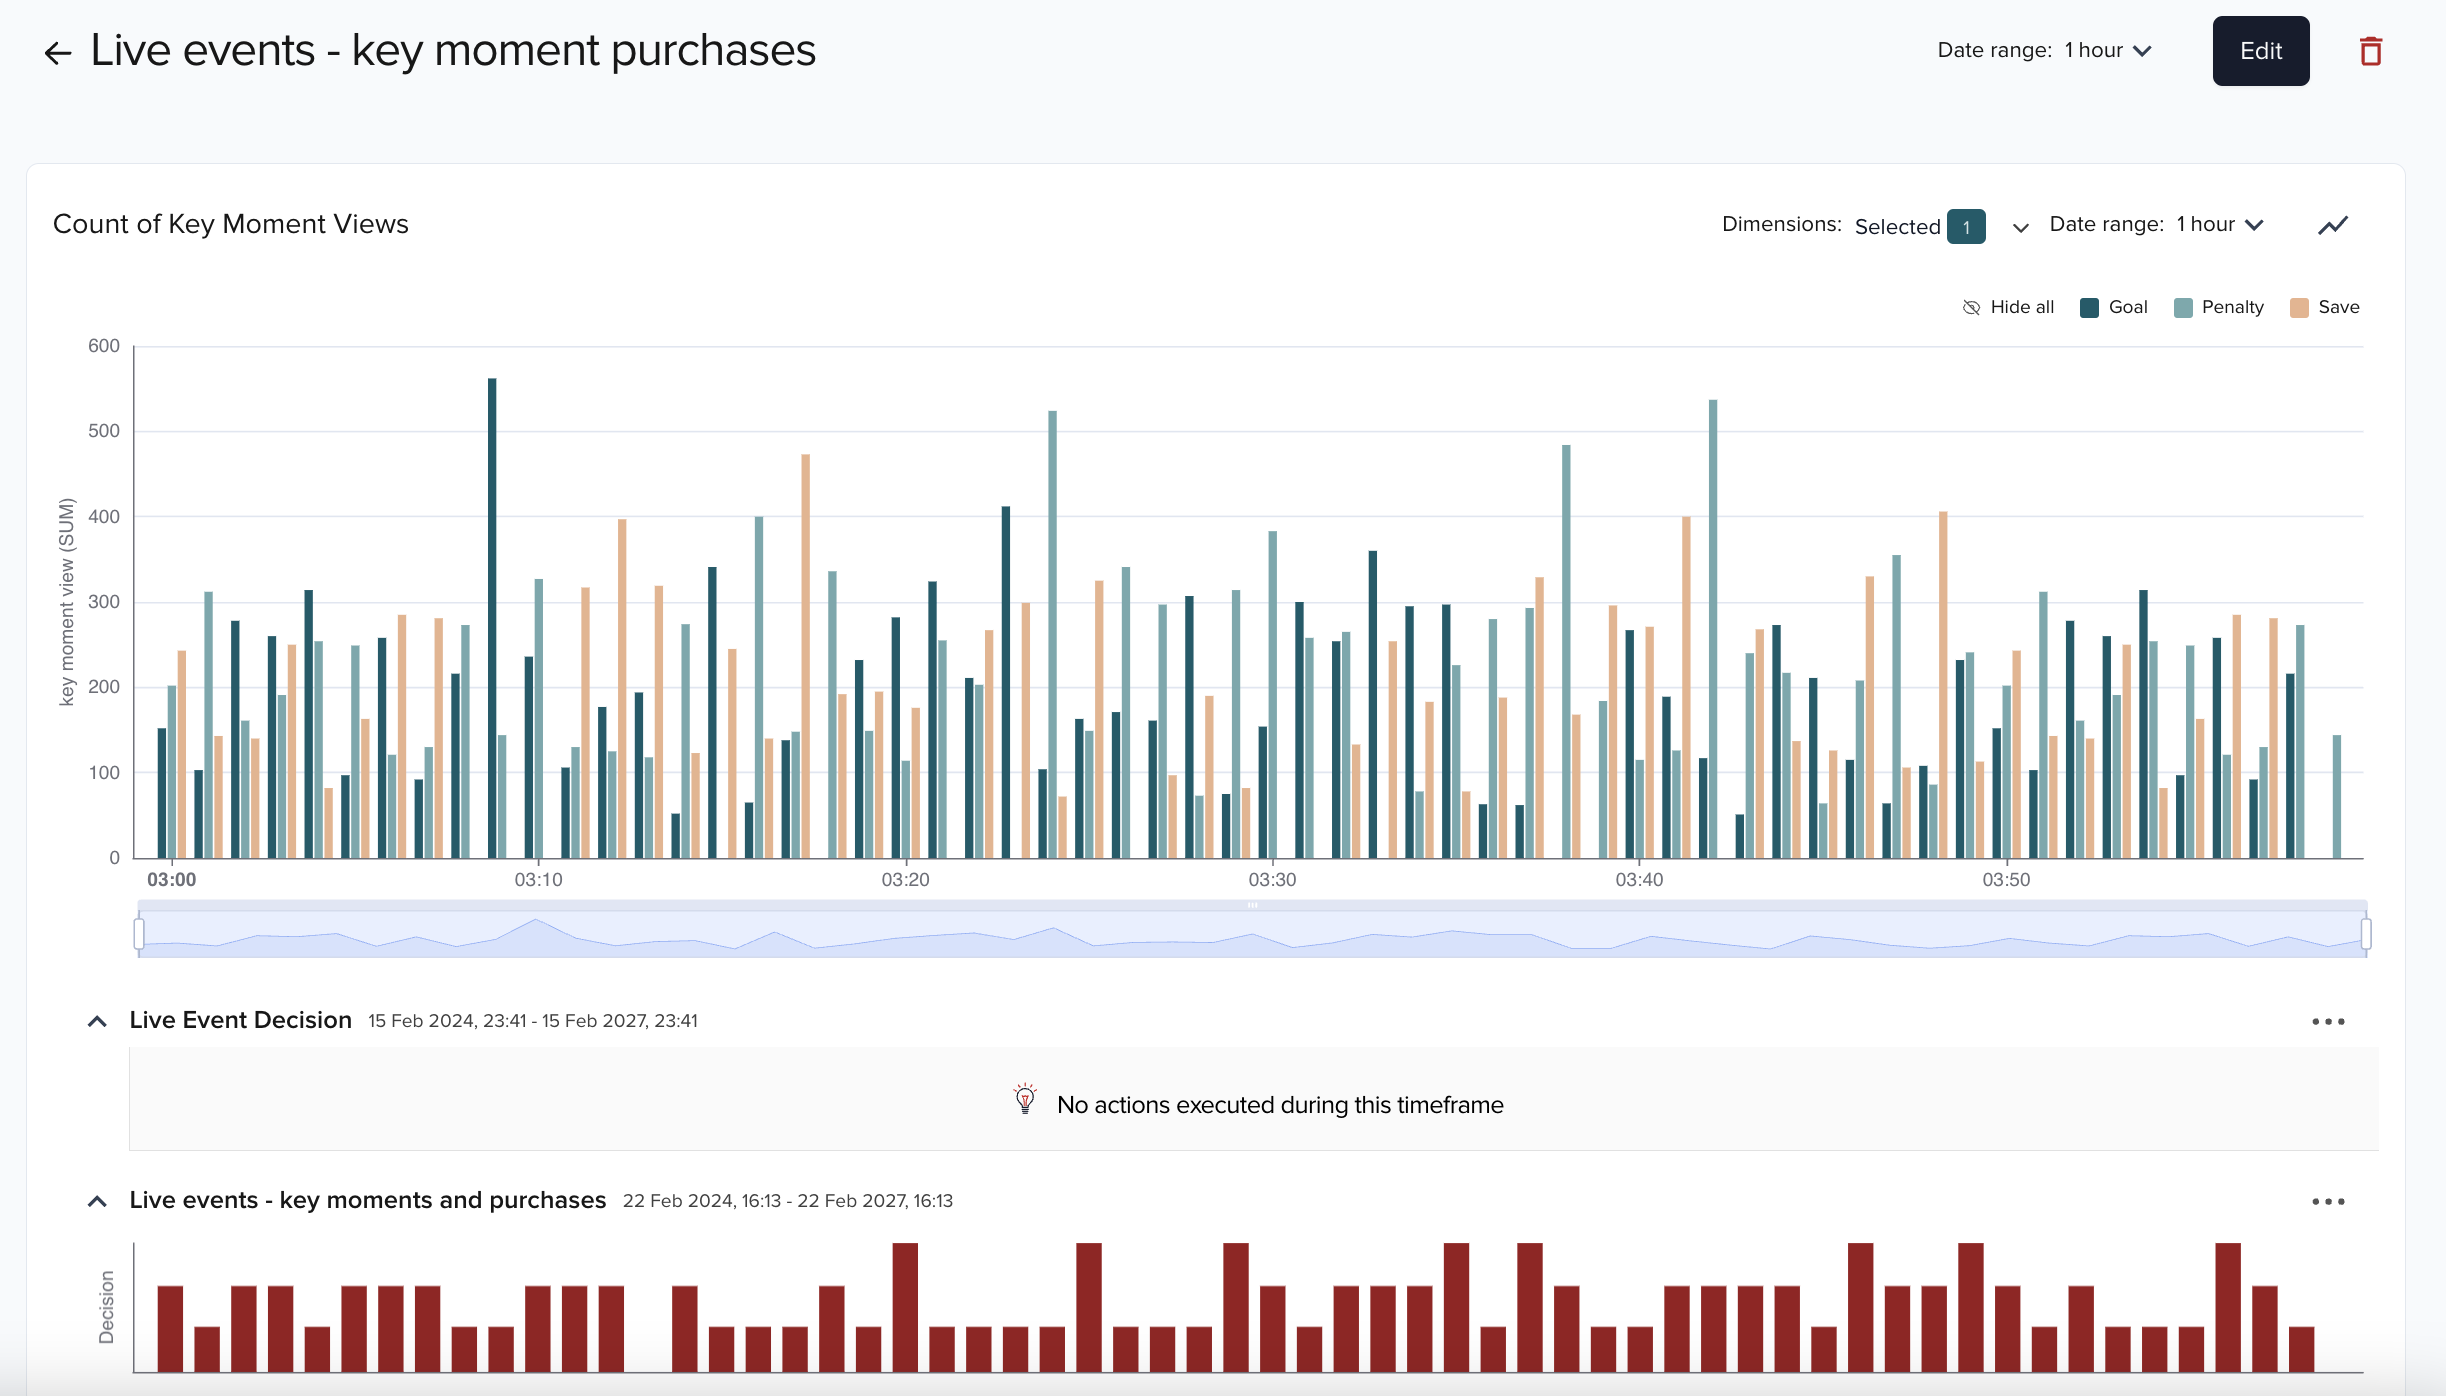
- If the chart uses a Business Object in a Decision, you see a decision preview at the bottom of the chart. Use it to monitor when actions were triggered.
- To see data, make sure the Business Object for the metric is active.
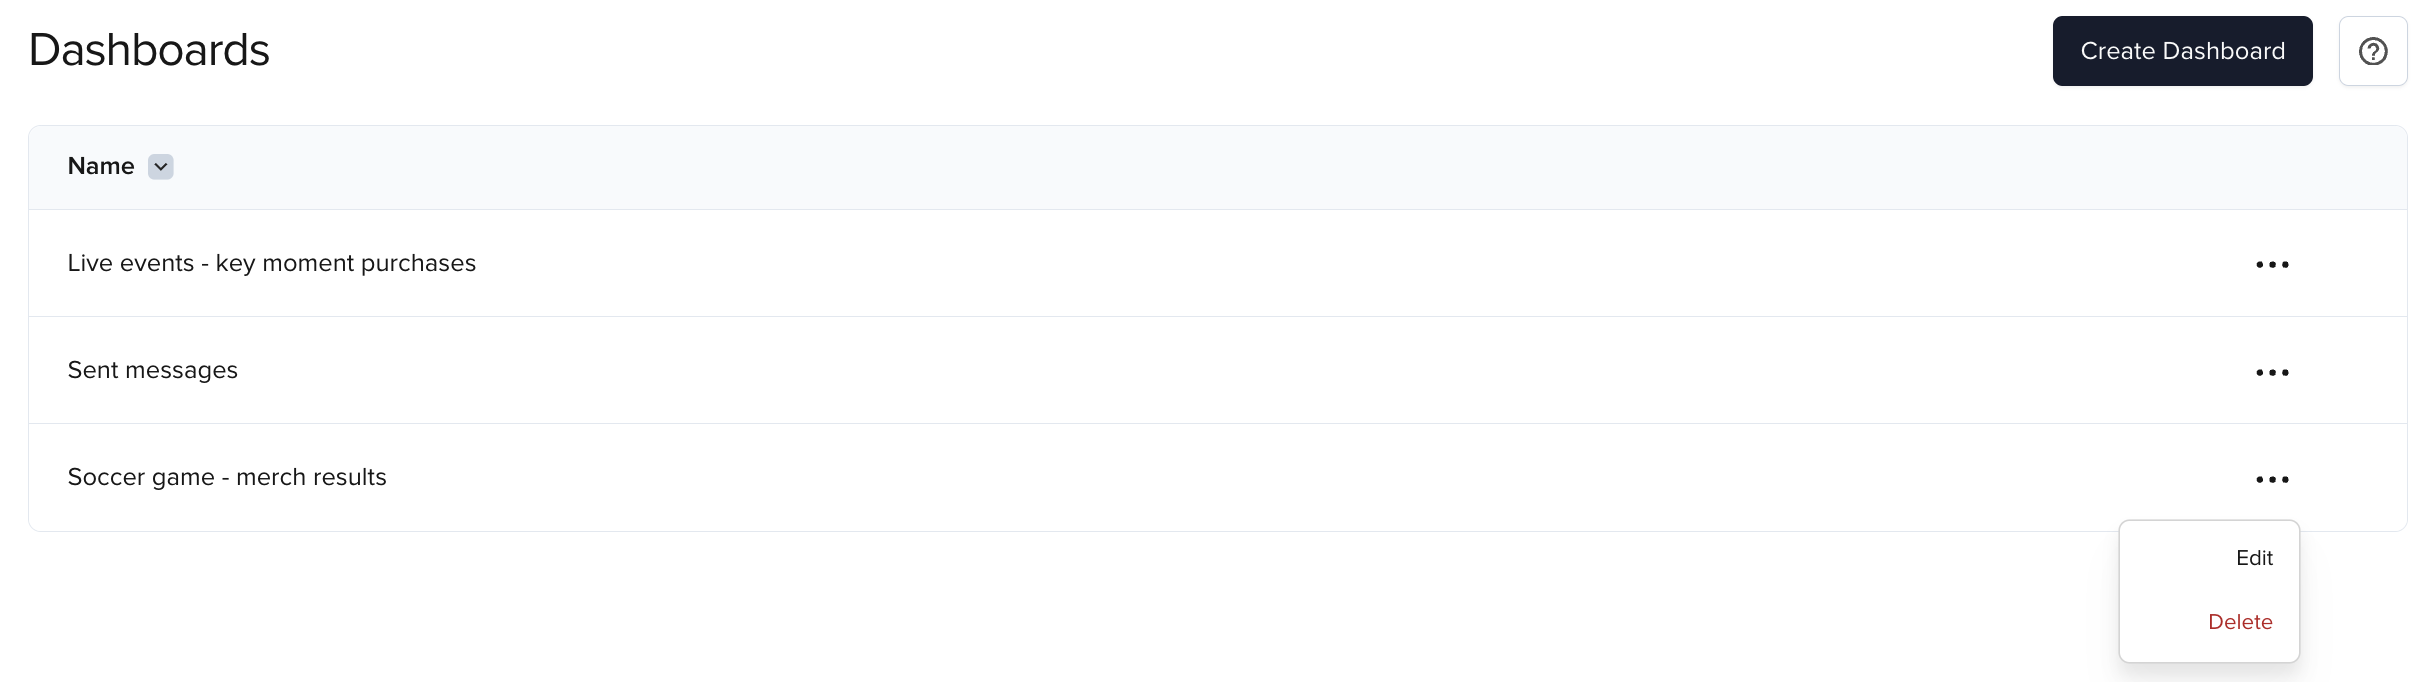
Home page
The Dashboards home page lists all charts and Dashboards you created.
Use the Ellipsis (...) button next to each chart to edit or delete it.
Settings
In a Dashboard view, you can edit or delete charts and Dashboards using the menu options.
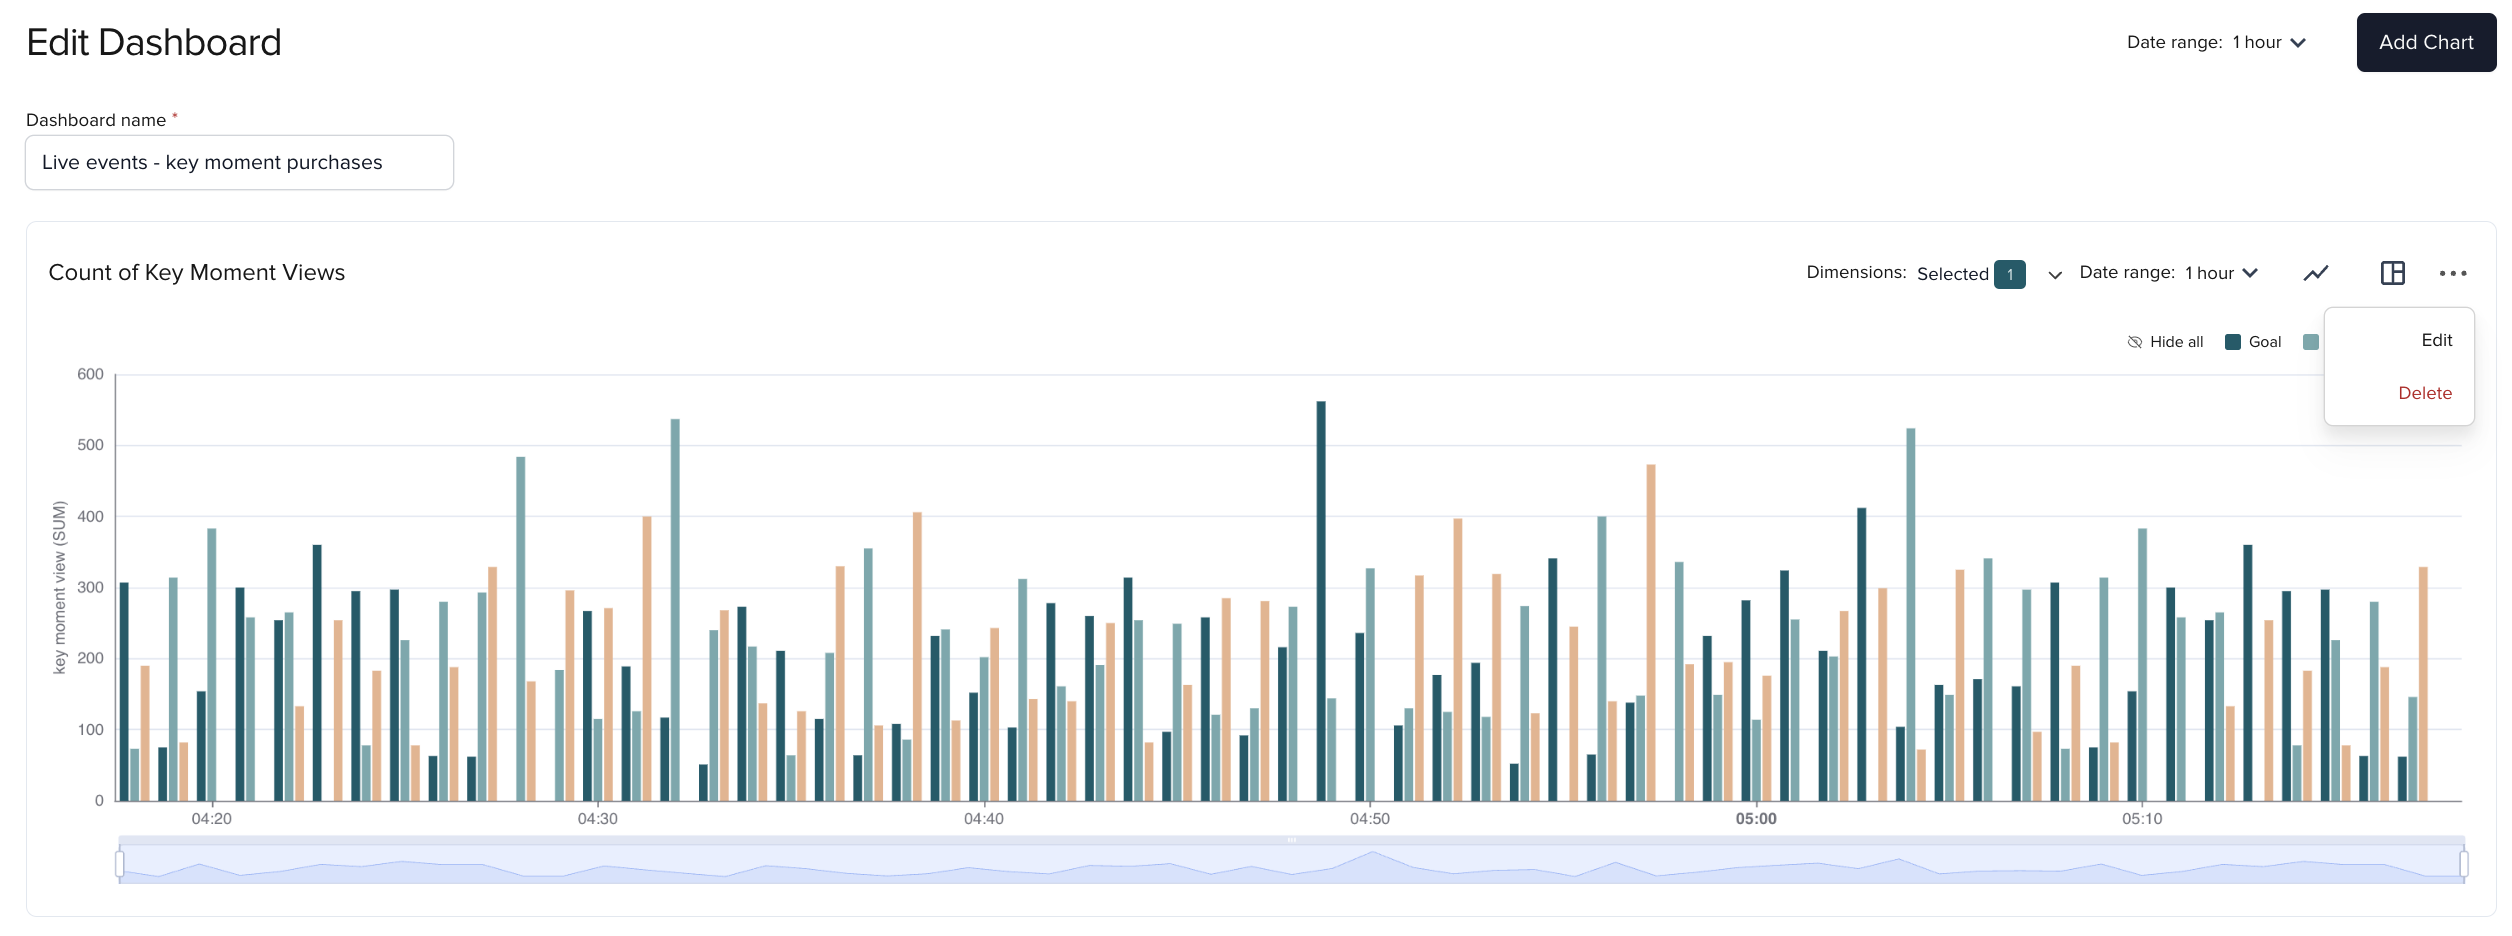
In a chart view, switch between bar, stacked bar, and line chart types using the chart type icon. Use the width icon to set charts to full‑width or half‑width.
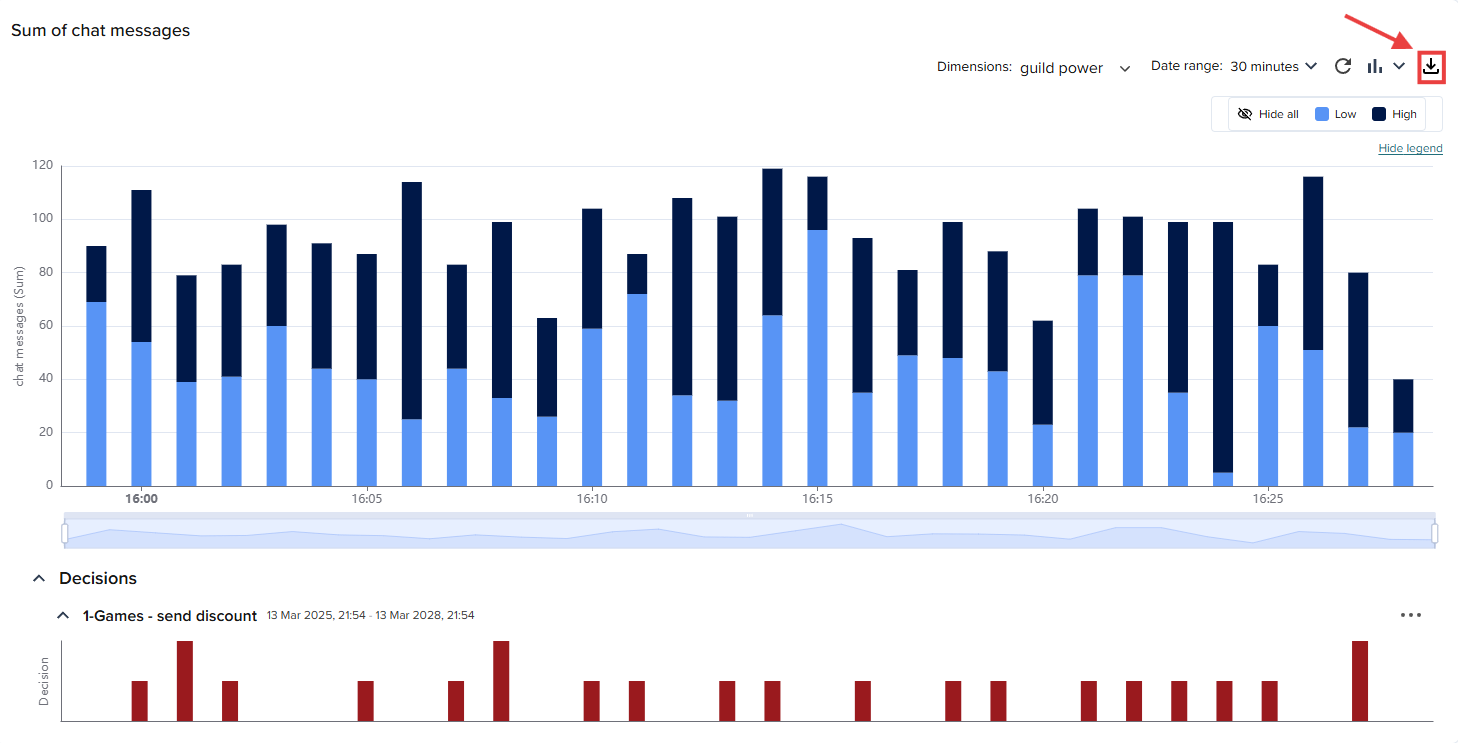
Export chart data
- You can download the chart data in
.csvformat by clicking the download button in the upper-right corner of the chart. - The chart data is downloaded as a
.zipfile that contains a.csvfile with a maximum of 1 million rows. The export follows your selected date range and dimensions.