Operational Dashboards
PubNub Operational Dashboards give you visibility into your app’s performance. They are preconfigured dashboards that monitor a selected subscribe key. The service collects real-time information about your app’s requests to PubNub APIs.
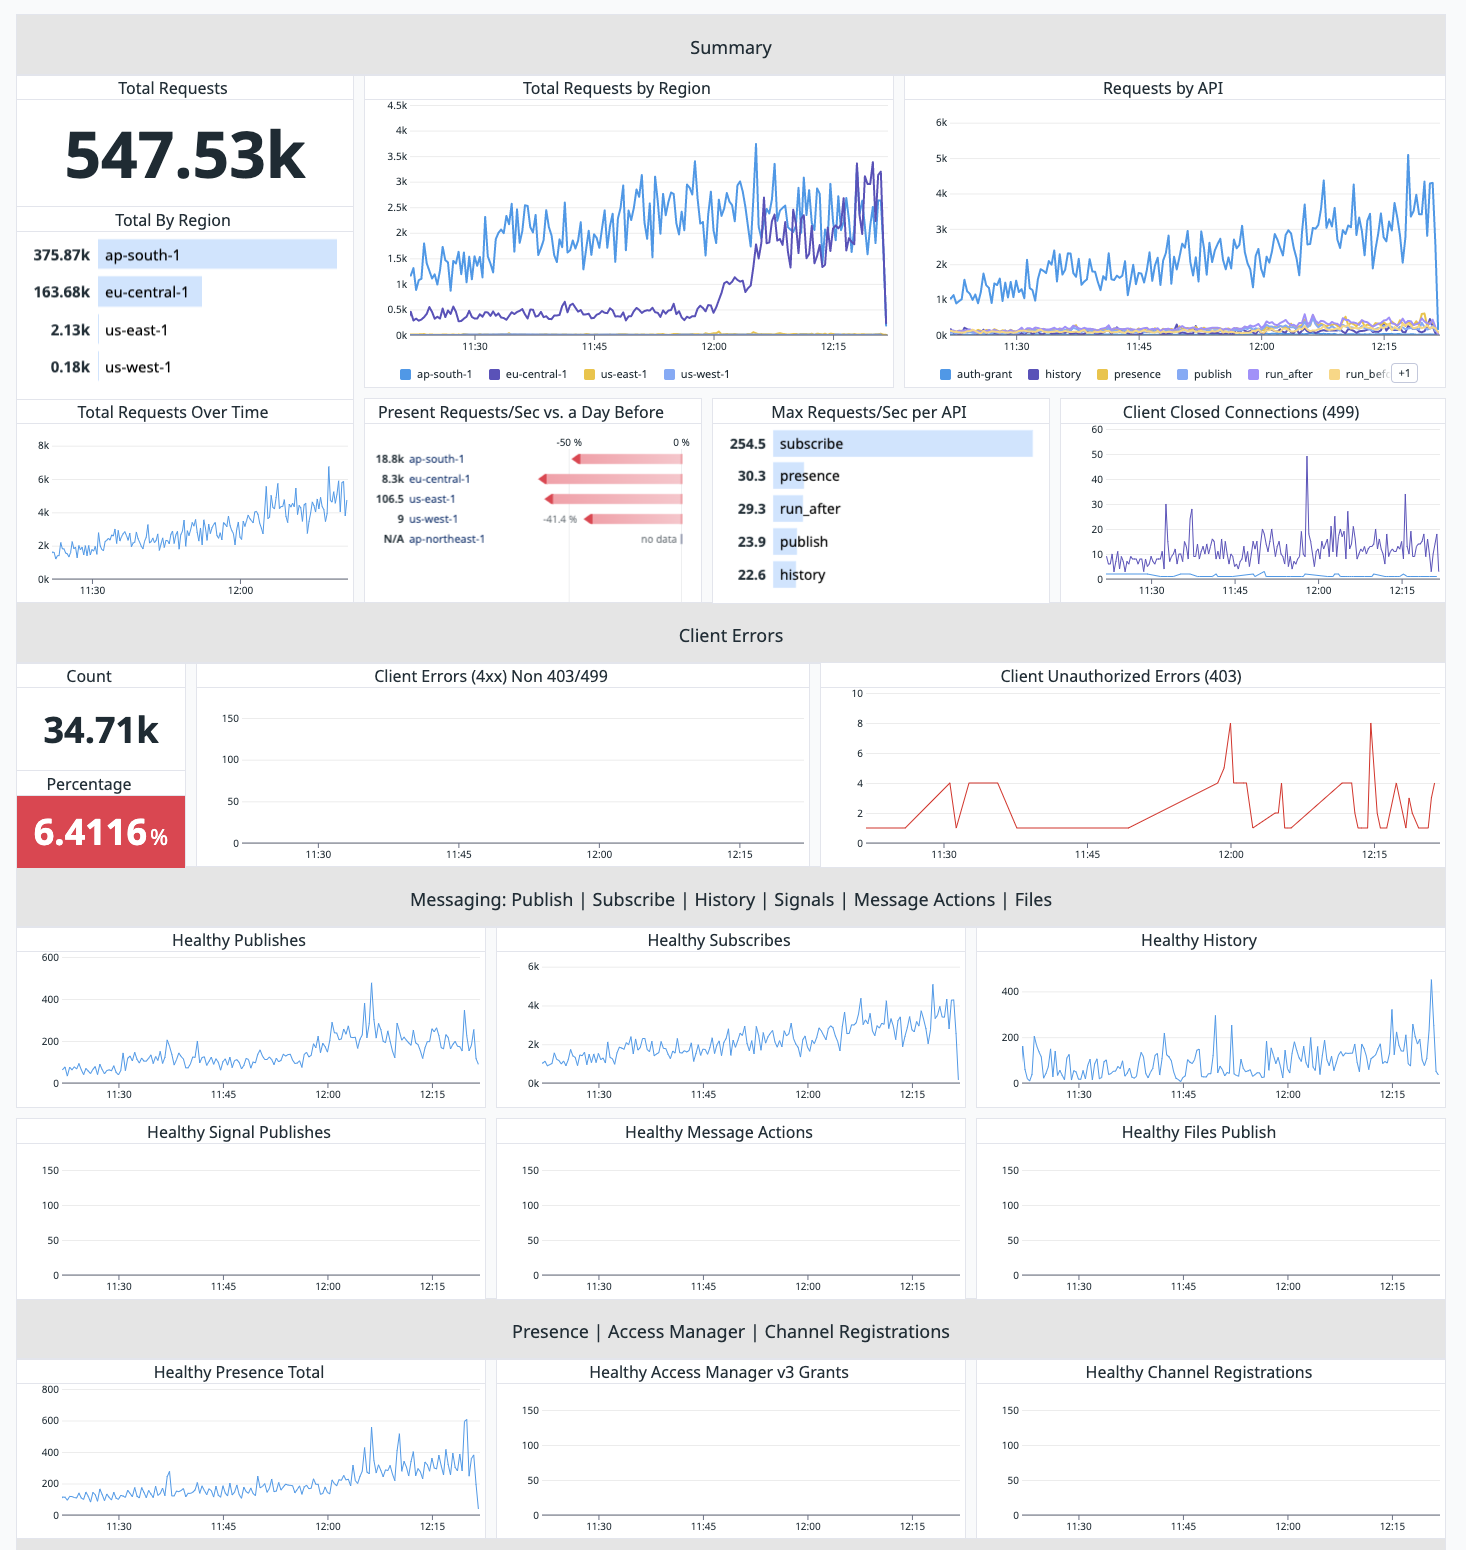
Operational Dashboards include:
- Summary metrics about the total app usage with a fixed time range (metrics from the last hour, updated every 5 minutes)
- Regional service usage for all 5 PubNub data centers (
us-east-1: Virginia,us-west-1: California,eu-central-1: Frankfurt,ap-northeast-1: Tokyo,ap-south-1: Mumbai) - Max requests per second (RPS) for the selected time and the RPS change from the same period the previous day
- Separate sections on server and client errors, including error percentage of total requests
- Green/Yellow/Red color coding for client percentage errors (green up to 1%, yellow 1–5%, red over 5%)
- Functions breakdown for inbound and outbound requests and errors
- Push notification requests
Benefits
These metrics let you:
- Visualize PubNub app performance with counters, graphs, and color coding.
- See whether services run as expected or show an outage. Find and solve problems to maintain a high standard of service for your users.
- Operate reliably during usage spikes. For live events, detect latency quickly and act to keep audiences engaged in real time.
- Integrate your PubNub app usage info into your own ops monitoring environment.
Availability
Operational Dashboards are available on Gold, Platinum, and Enterprise Support plans. The scope differs by plan:
| Feature | Gold | Platinum | Enterprise |
|---|---|---|---|
| Link to a real-time dashboard with metrics | Yes (addon) | Yes | Yes |
| Real-time metrics data export | No | No | Yes |
Dashboards show the following performance metrics for your app’s subscribe key:
- Summary
- Client errors
- Messaging
- Presence, Access Manager, and channels
- Server errors
- Functions
- Push notifications
Access
Request access by raising a PubNub support ticket.
Request dashboard access
Platinum Support includes one operational dashboard for one subscribe key. Enterprise Support includes unlimited dashboards.
To request access, raise a PubNub support ticket or contact support. Include:
- Subscribe key to track in the dashboard
- Accessibility settings for the dashboard link (public link or restricted to specified email addresses)
After we process your request, you receive a link to your operational dashboard with PubNub API performance metrics.
If you need metrics for more than one subscribe key on Platinum Support (for example, to track both prod and dev), contact sales to discuss pricing.
Request metrics export
If you have Enterprise Support and your own ops monitoring environment, you can request an export of dashboard data. This lets you integrate app‑specific metrics into tools like Datadog or New Relic instead of viewing them only on a separate dashboard link. For details, see the list of available raw data queries.
To request a metrics export, open a PubNub support ticket or send an email with:
- Datadog API Key
- Datadog Region (if not the default US region)
- New Relic Insert key
- New Relic Datacenter (if not US)
After export is enabled, use sample queries to visualize the raw metrics in your monitoring tool.