Performance metrics
Once you have access to your Operational Dashboards, you see sections that show requests your app makes to various PubNub APIs. Use this guide to interpret each metrics section on your static dashboard.
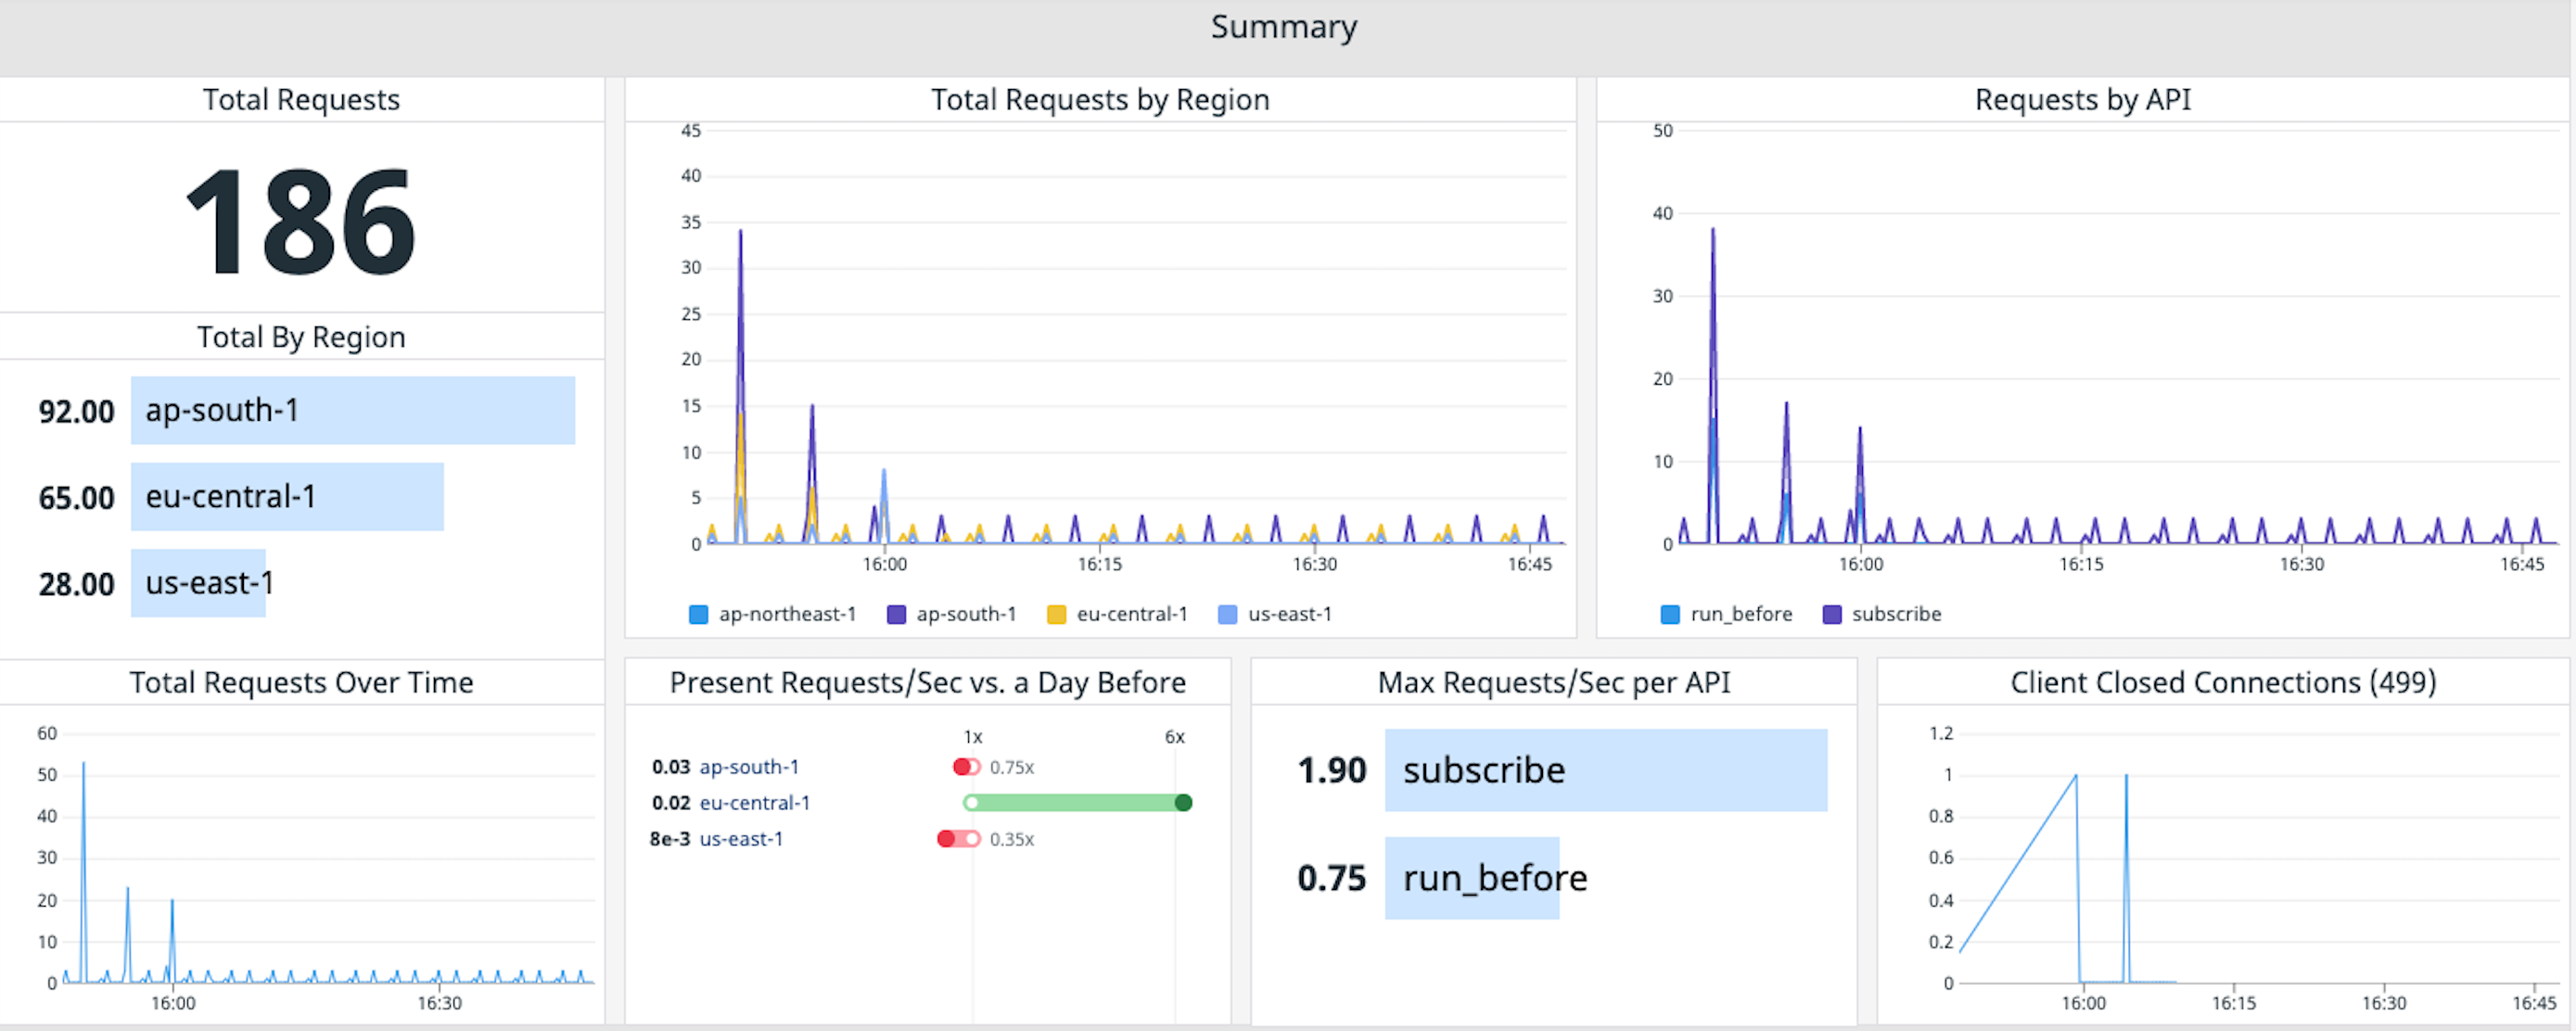
Summary
This section shows the last hour of traffic. View the number of requests in the previous hour, a regional breakdown, and a graph of total requests per five‑minute interval.
The top charts show how requests are distributed across PubNub data centers and your API usage over the last hour.
At the bottom, a graph compares the current hour’s requests to the same time yesterday. You also see max requests per second for the top five APIs in the last hour and the number of clients that disconnected every five minutes.
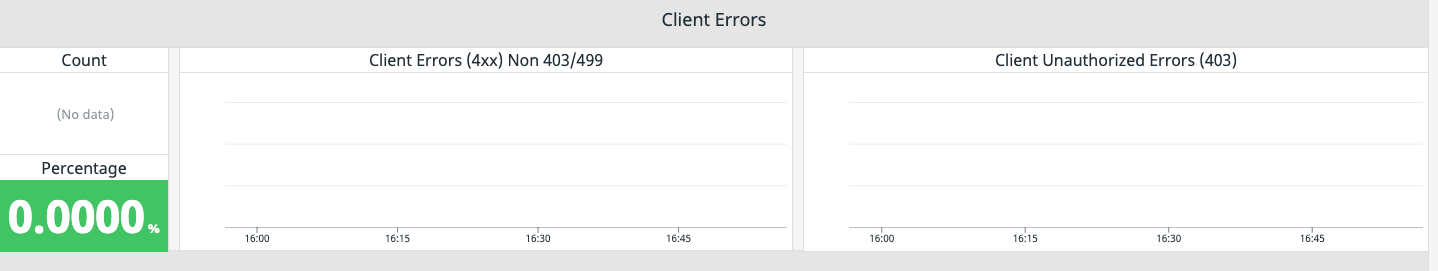
Client errors
Use this section to verify that your application works correctly. It shows the count of API calls that returned a 4XX response and the percentage of calls that returned an error.
Two tables break the 4XX responses into categories.
- The left table shows non‑
403error codes. These often come from invalid API calls. Check clients for coding errors. - The right table shows
403Not Authorized errors. If you use Access Manager, this can indicate an error in token provisioning logic or attempted calls by unauthorized users.
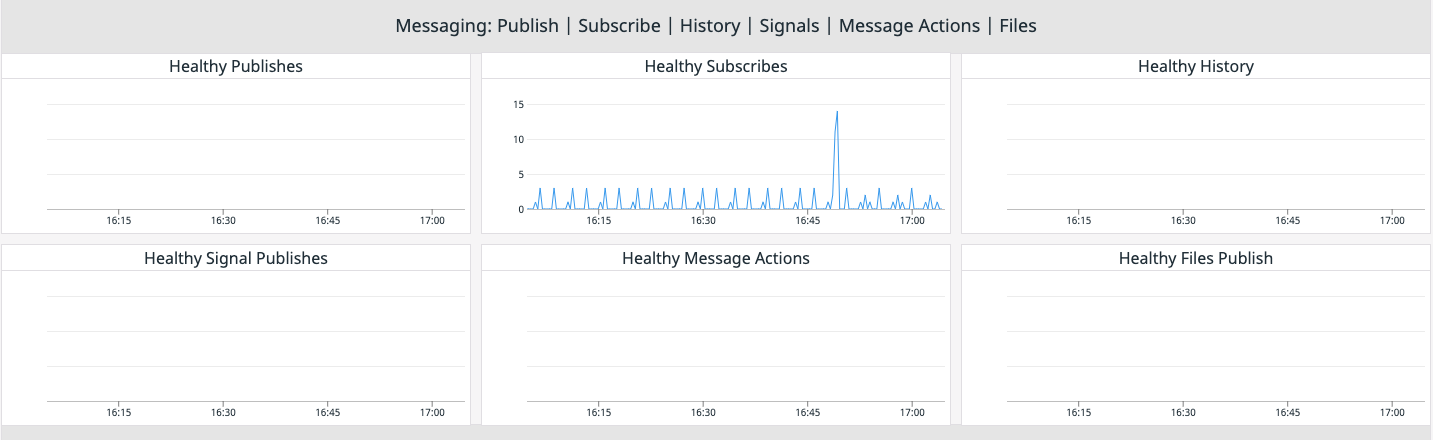
Messaging
This section shows call counts for each messaging API and a graph of successful requests per five‑minute interval.
Presence, Access Manager, and channels
This section shows usage for Presence, Access Manager, and channel group.
The first graph shows counts for hereNow, whereNow, and Presence heartbeat calls. The second shows Access Manager token grants (v3). The last table shows calls to addChannels, listChannels, and removeChannels.
Server errors
This graph shows counts of API calls that returned a 5XX server error. If you see multiple 5XX errors, contact support or check the status board. This can indicate a platform issue.

Functions
View availability
This view is provided in the operational metrics dashboard, but not available through the export offer.
If you configured your keyset with Functions, use this section to monitor behavior.
The first table shows counts of function executions triggered by a publish event or a call to the function’s public URL. The second shows the number of outbound XHR requests performed by functions. The final table shows function errors.
If you see errors, inspect the function code and any endpoints used by XHR requests. Some functions return errors by design. Depending on your logic, errors in this table may or may not be a concern.
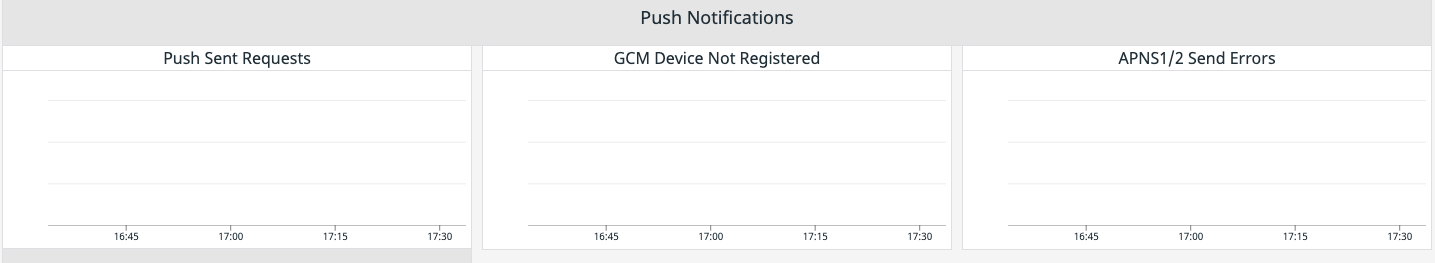
Push notifications
View availability
This view is provided in the operational metrics dashboard but not available through the export offer.
If you configured your keyset with push notifications, use this section to monitor behavior.
The first graph shows counts of attempts PubNub made to send push requests. The next two show the number of errors returned by Apple and Android push providers.
Most errors come from token configuration. Check your logic and ensure the tokens configured in PubNub are valid and not expired.