Monitoring Metrics
The Monitoring Metrics tab shows charts that help you monitor your app at a glance.
Filters and types
Click a transaction type to filter. Hover over a type to see a tooltip.
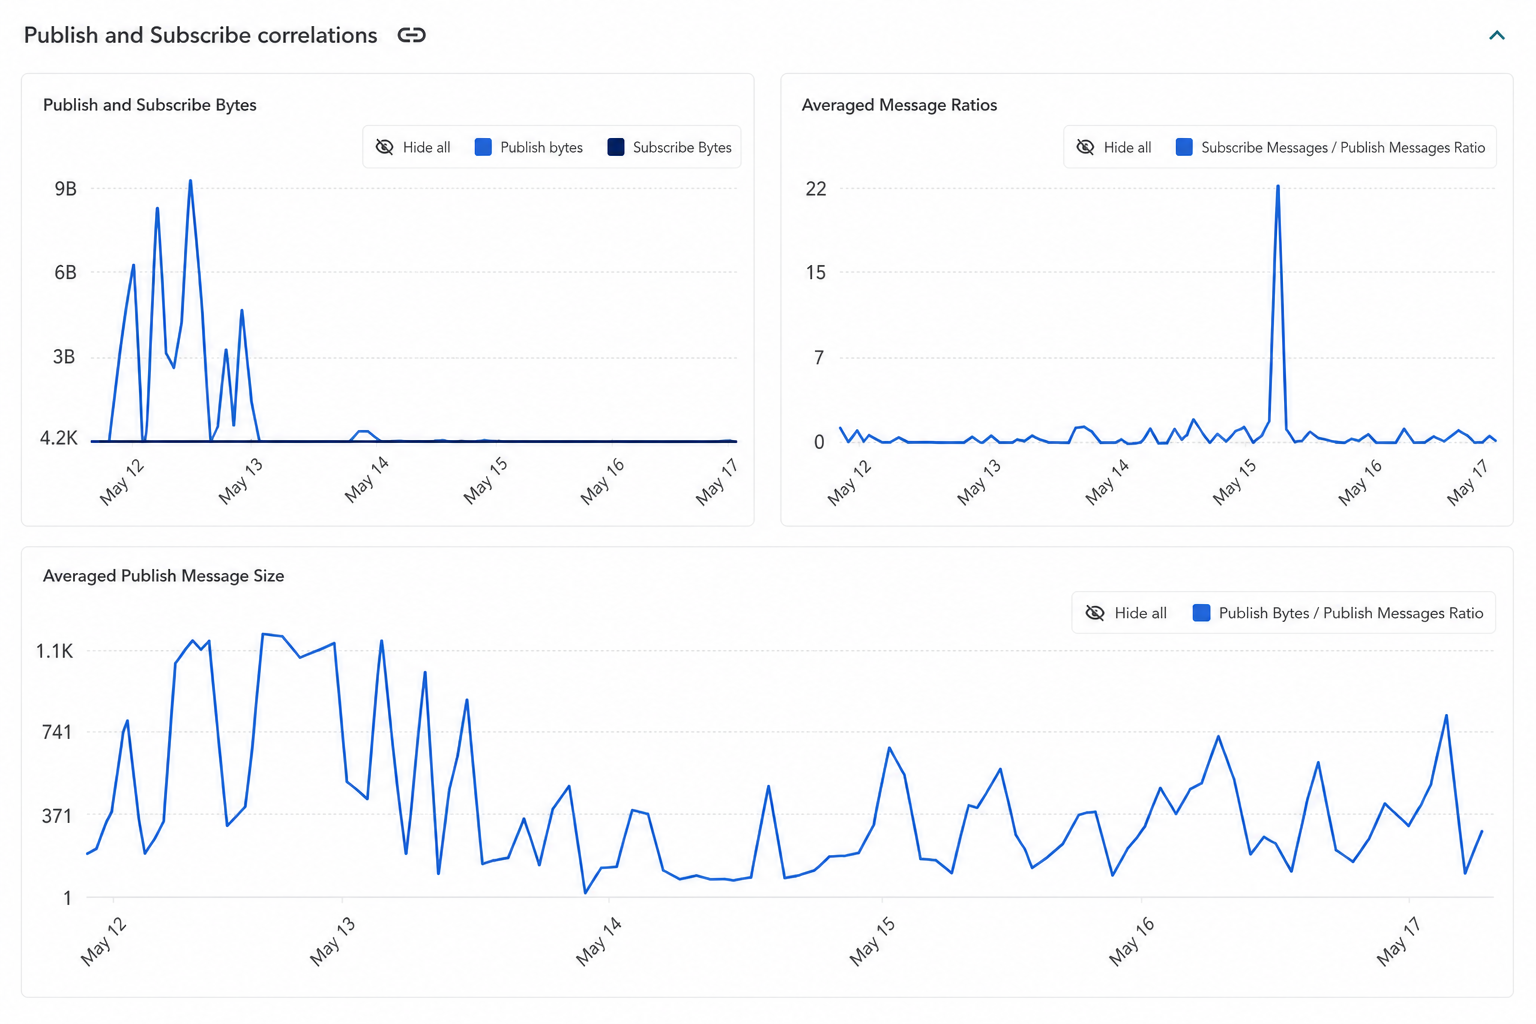
Publish/Subscribe correlations
Shows the total number of Transactions for the Publish/Subscribe API over the selected time range.
This section includes three charts:
- Publish and Subscribe Bytes — The volume of data sent and received via the Publish/Subscribe API.
- Averaged Publish Message Size — The average size of a published message over time (Publish Bytes / Publish Messages ratio).
- Averaged Message Ratios — Also called the Sub/Pub Ratio or broadcast factor. This measures the average number of messages received per message published across all channels in your application.
Averaged Message Ratio (broadcast factor)
The ratio reflects how broadly messages are distributed across subscribers:
| Ratio | Typical behavior | Example use cases |
|---|---|---|
| ~1:1 | Mostly direct communication between publisher and subscriber | One-to-one chat, private messaging |
| 5–50 | Moderate fan-out to multiple subscribers | Group chat, collaborative apps, IoT device control |
| 50+ | High broadcast distribution | Live events, webinars, auctions, influencer chat |
| < 1 | More messages published than received | May be expected if subscribers fetch messages from storage; can also indicate inactive subscribers, unused channels, or a misconfiguration |
Changes in the ratio over time can indicate:
- A newly deployed feature or app upgrade
- A live event or marketing campaign
- A change in subscriber engagement
- Misconfigured channels or subscriptions
:::note Broadcast factor below 1
A ratio below 1 is often caused by overly broad Presence configuration. If Presence is enabled across many channels, PubNub generates Presence events on corresponding -pnpres channels even when clients are not actively subscribing to them. This inflates the publish count relative to actual message delivery. If you consistently see a ratio below 1 and use Presence extensively, consider reviewing your Presence configuration and limiting it to channels that actually require it.
:::
The publish side of the ratio includes both messages explicitly published by the application and events automatically generated by PubNub services such as Presence events and App Context updates.
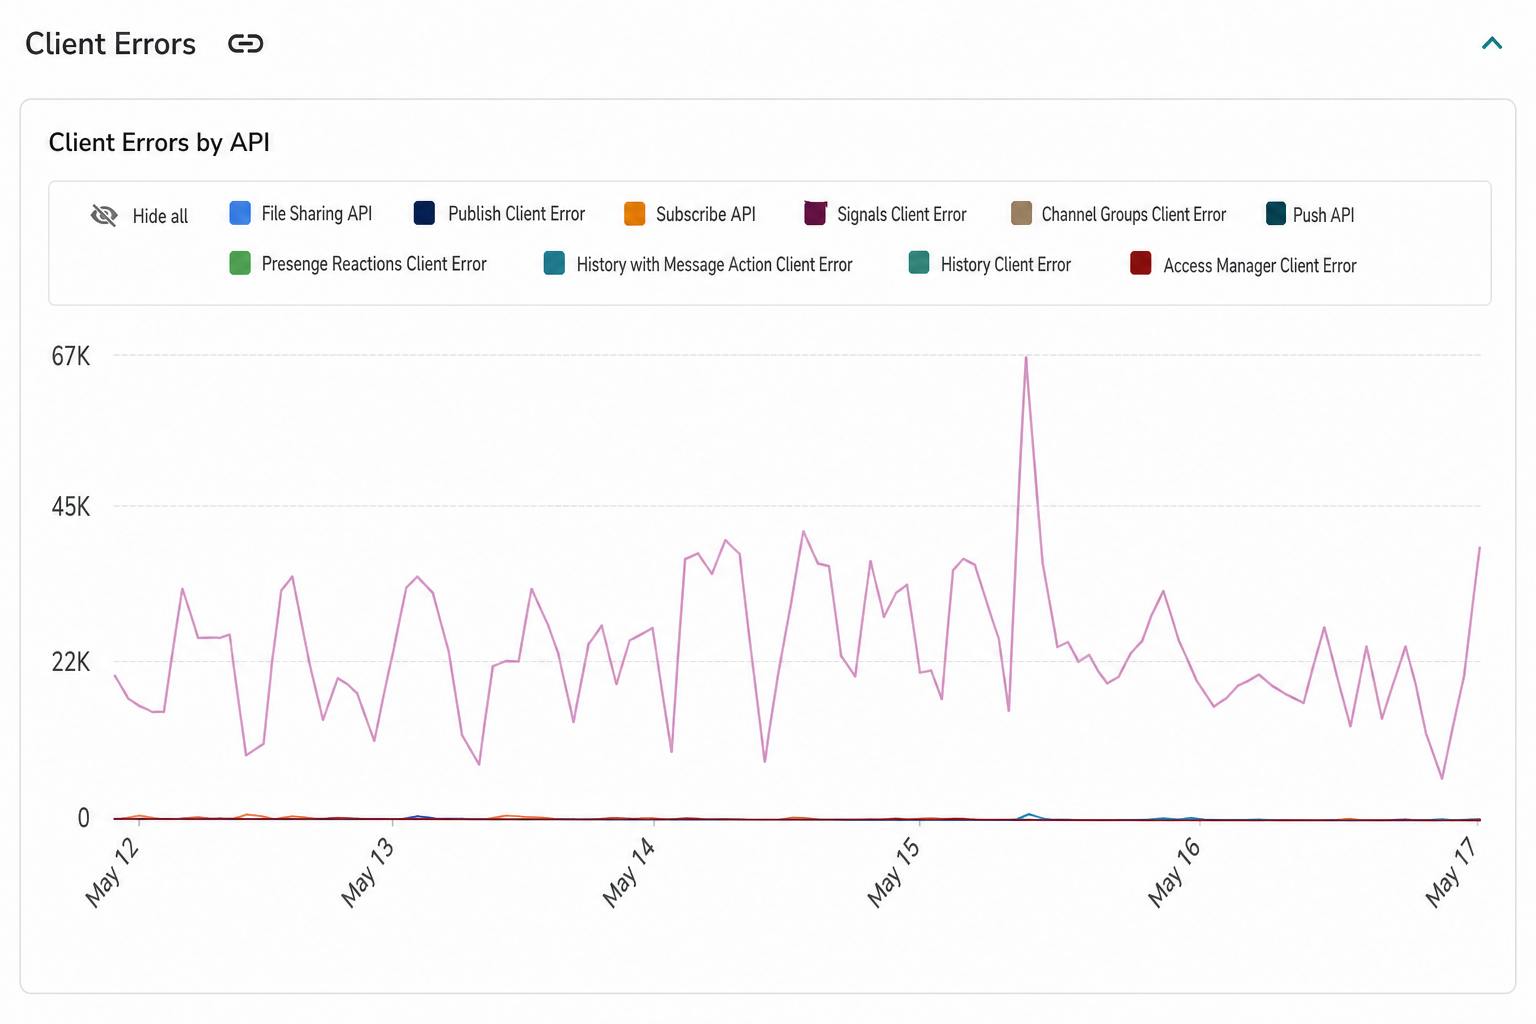
Client errors
Shows the total number of client errors grouped by API over the selected time range.
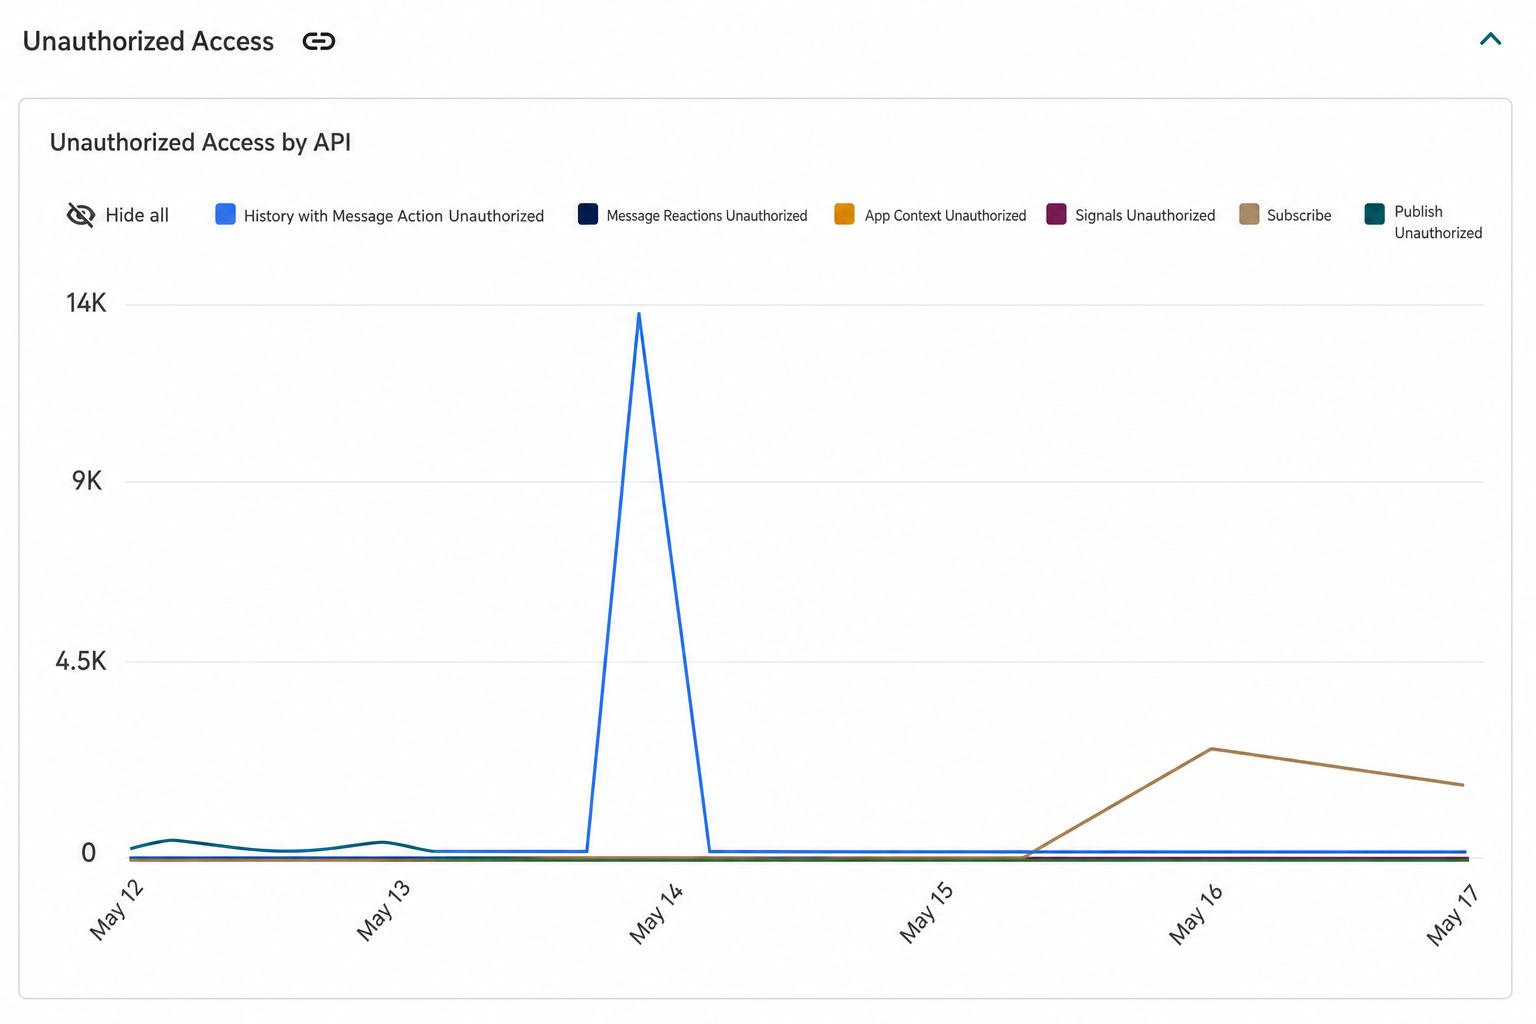
Unauthorized Access
Shows the total number of unauthorized access attempts grouped by API over the selected time range.
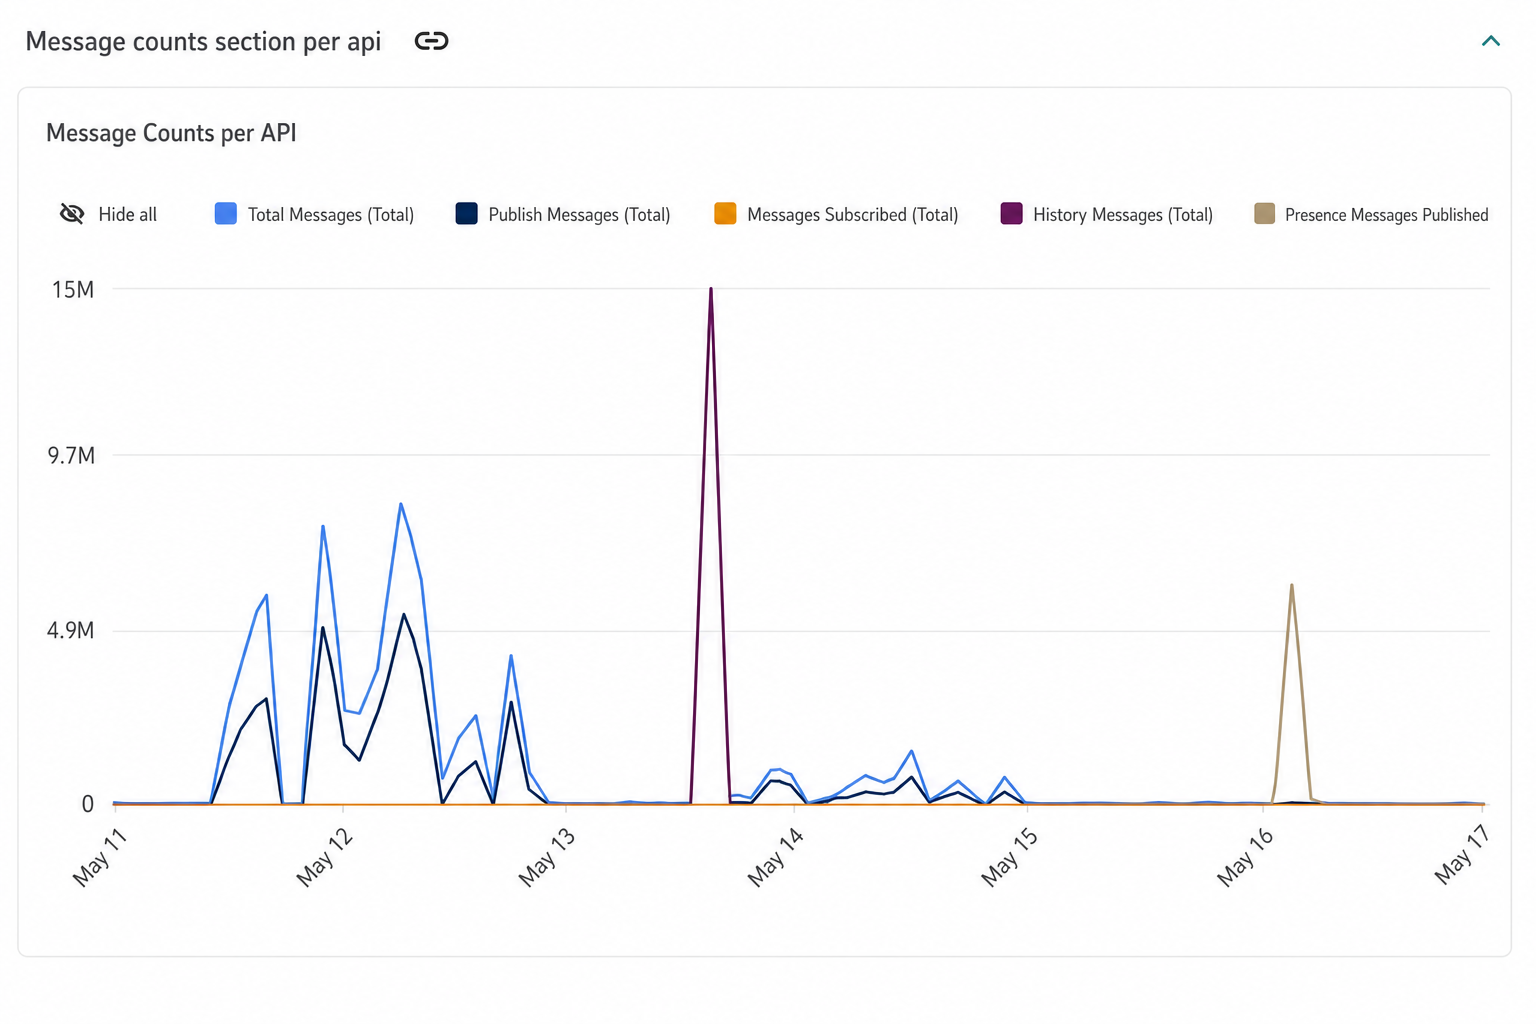
Message counts section per API
Shows the number of messages grouped by API over the selected time range.
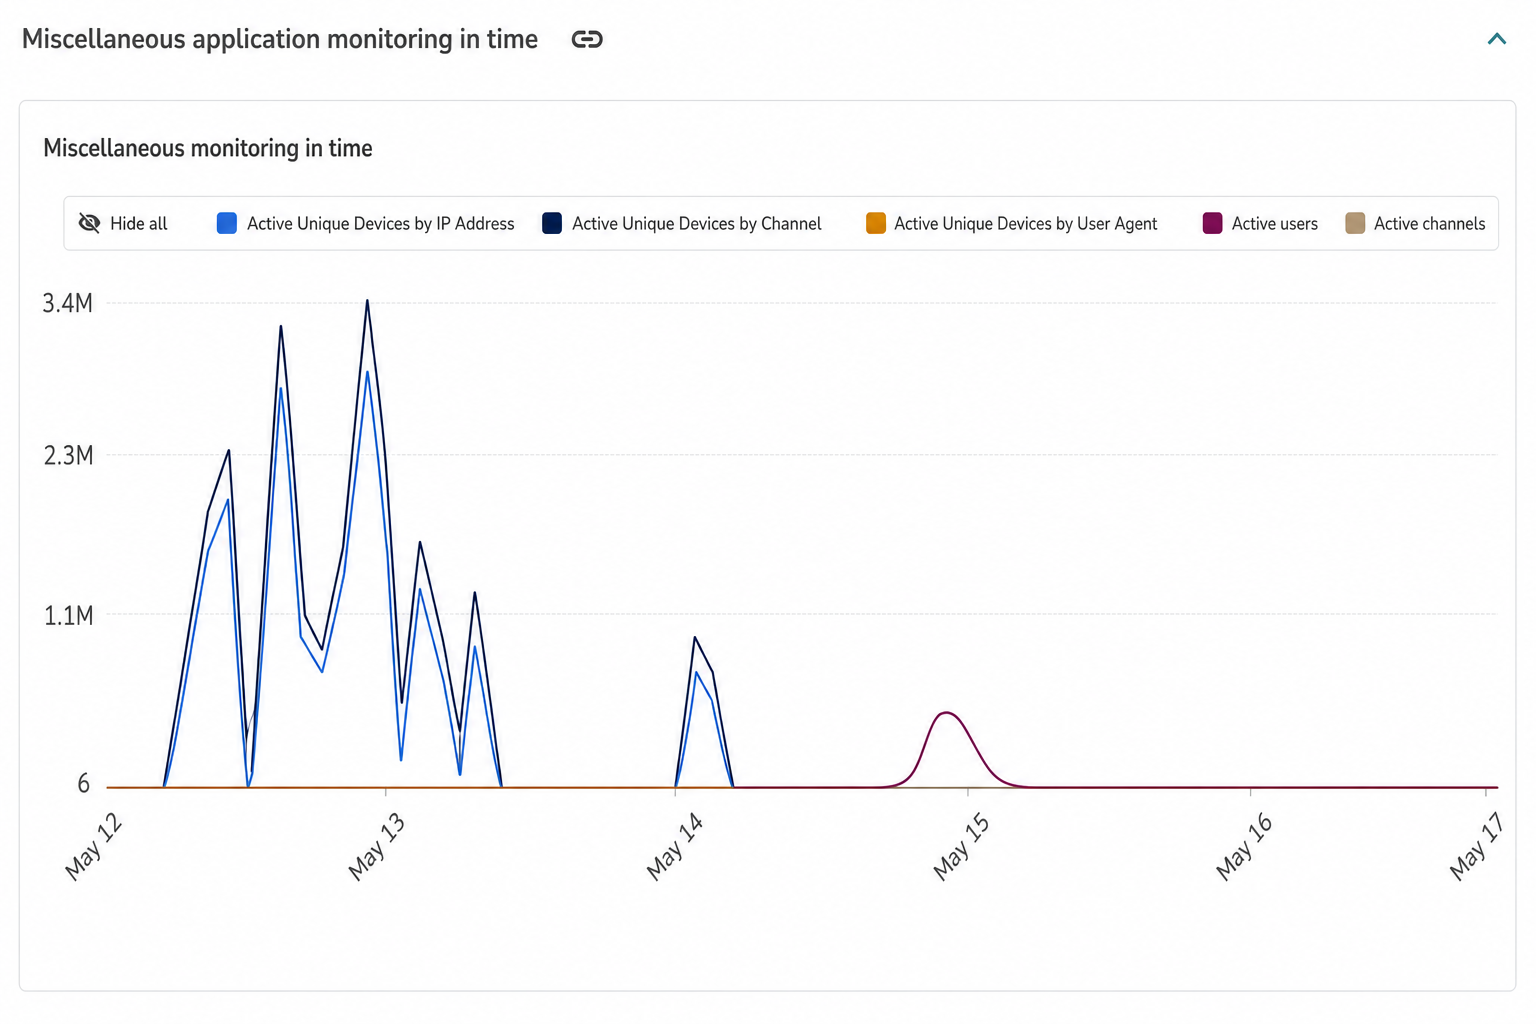
Miscellaneous application monitoring in time
Shows total activity over the selected time range.
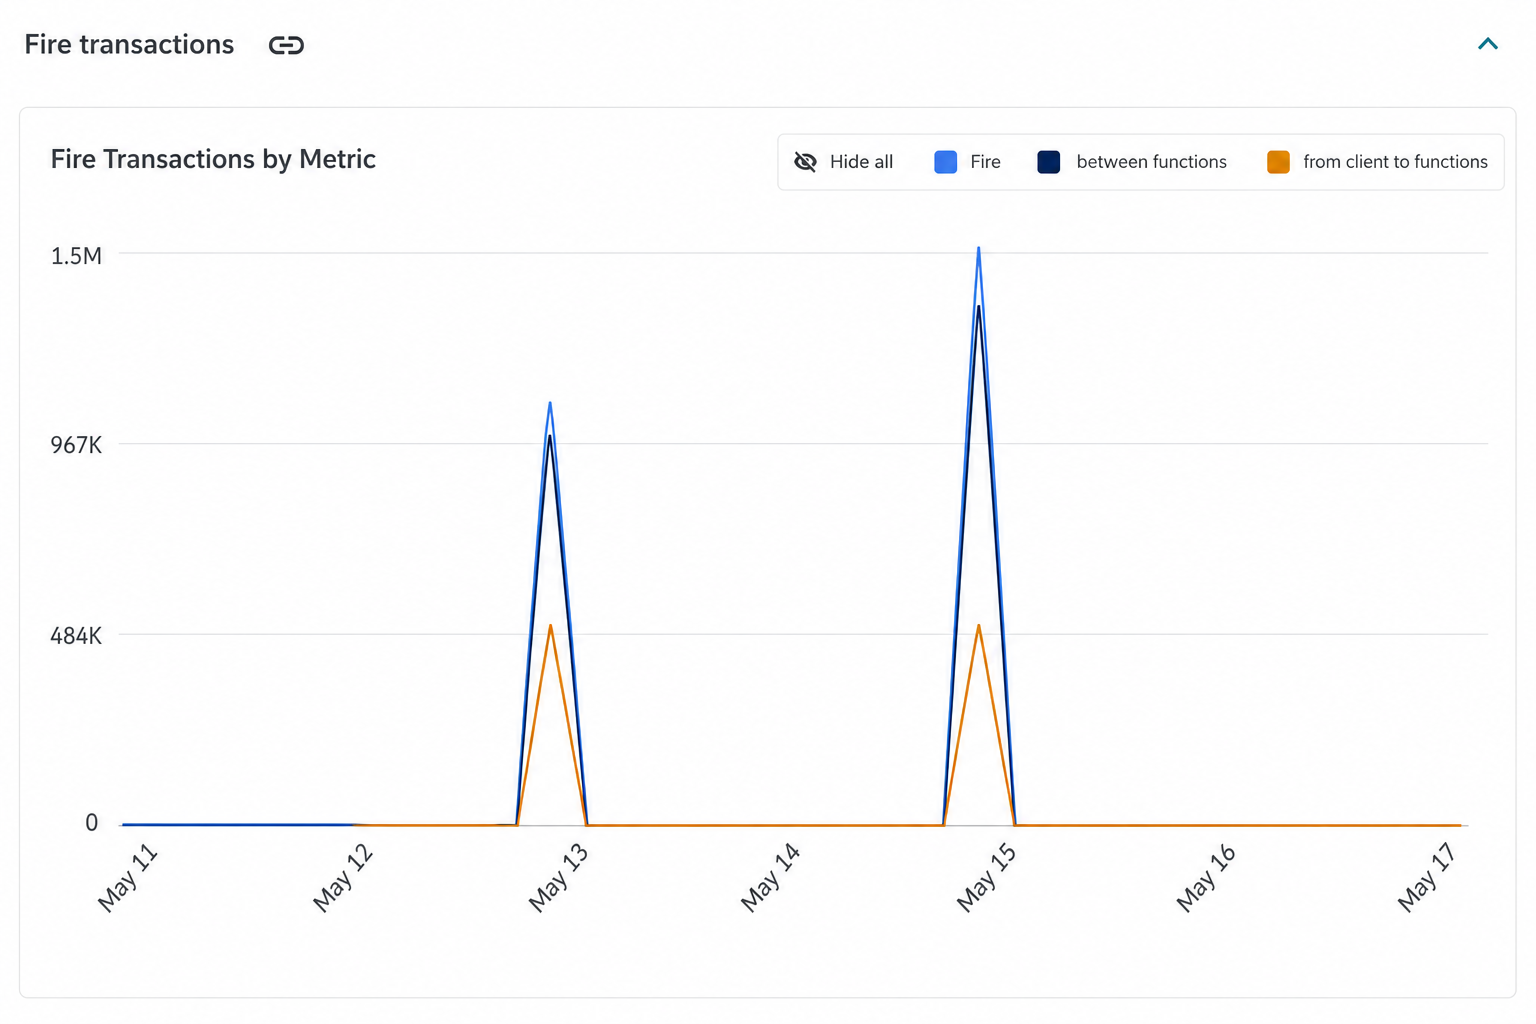
Fire transactions
Shows the total number of Fire transactions grouped by metric over the selected time range.