Billable Metrics
The Billable Metrics tab shows usage for billable features such as Presence, History, and Message Actions.
Filters and types
Click a transaction type in the chart to filter. Hover a type to see a tooltip.
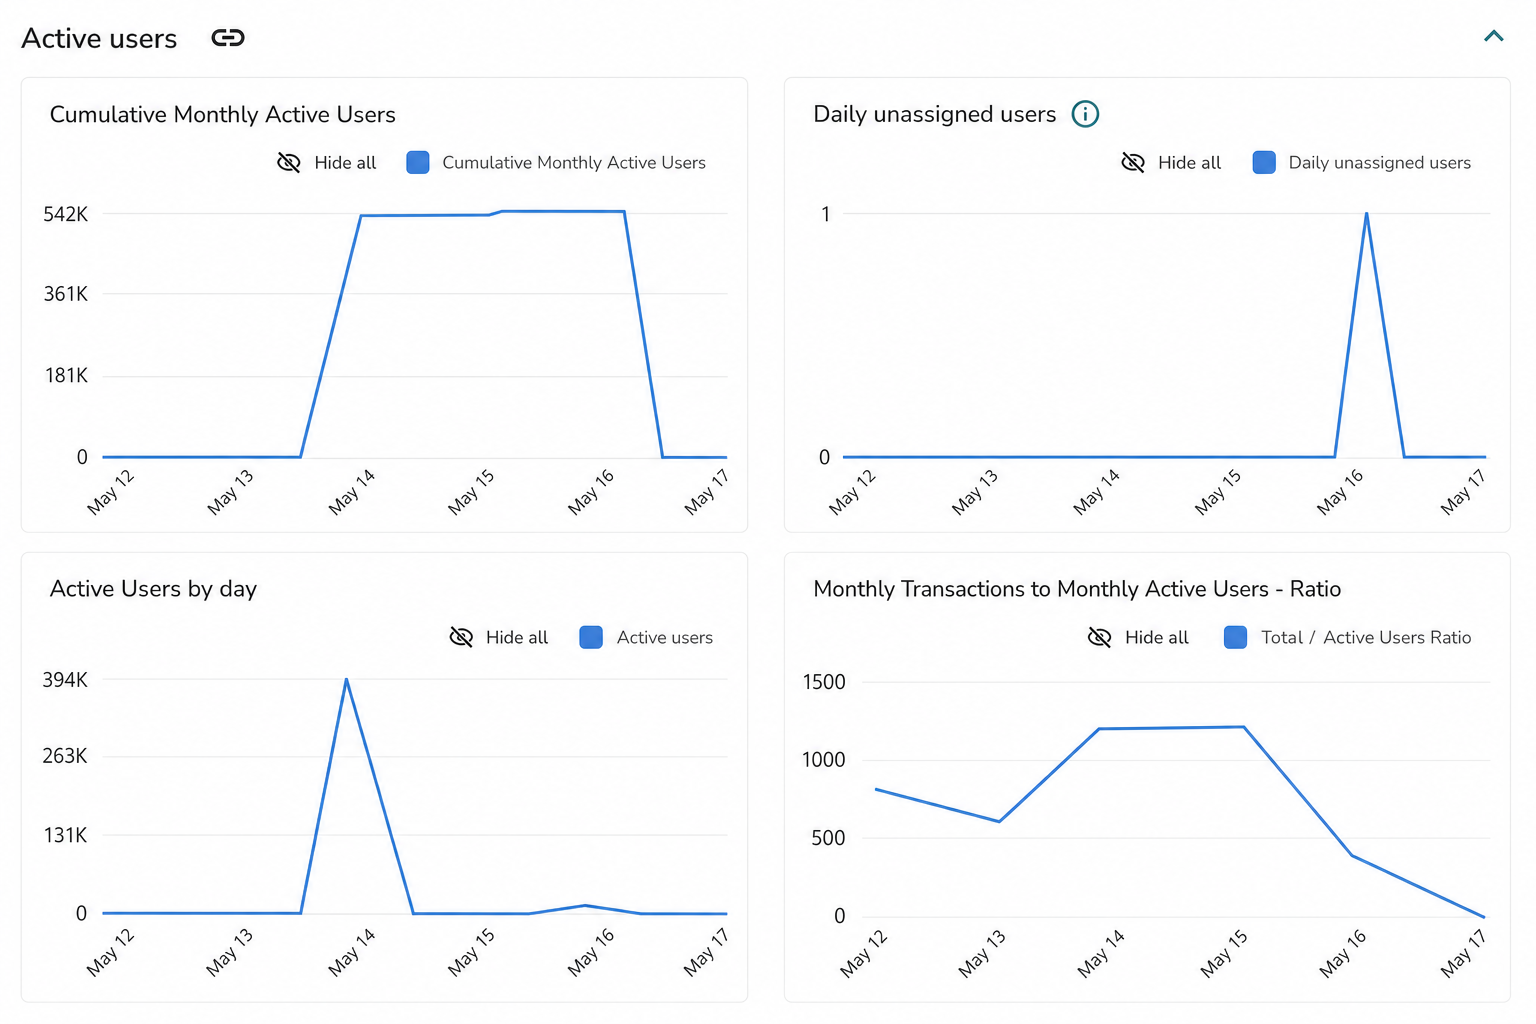
Active users
Shows the total number of Active Users over the selected time range.
Active user trends can be compared against other charts to identify whether changes in transaction volume correlate with changes in user activity.
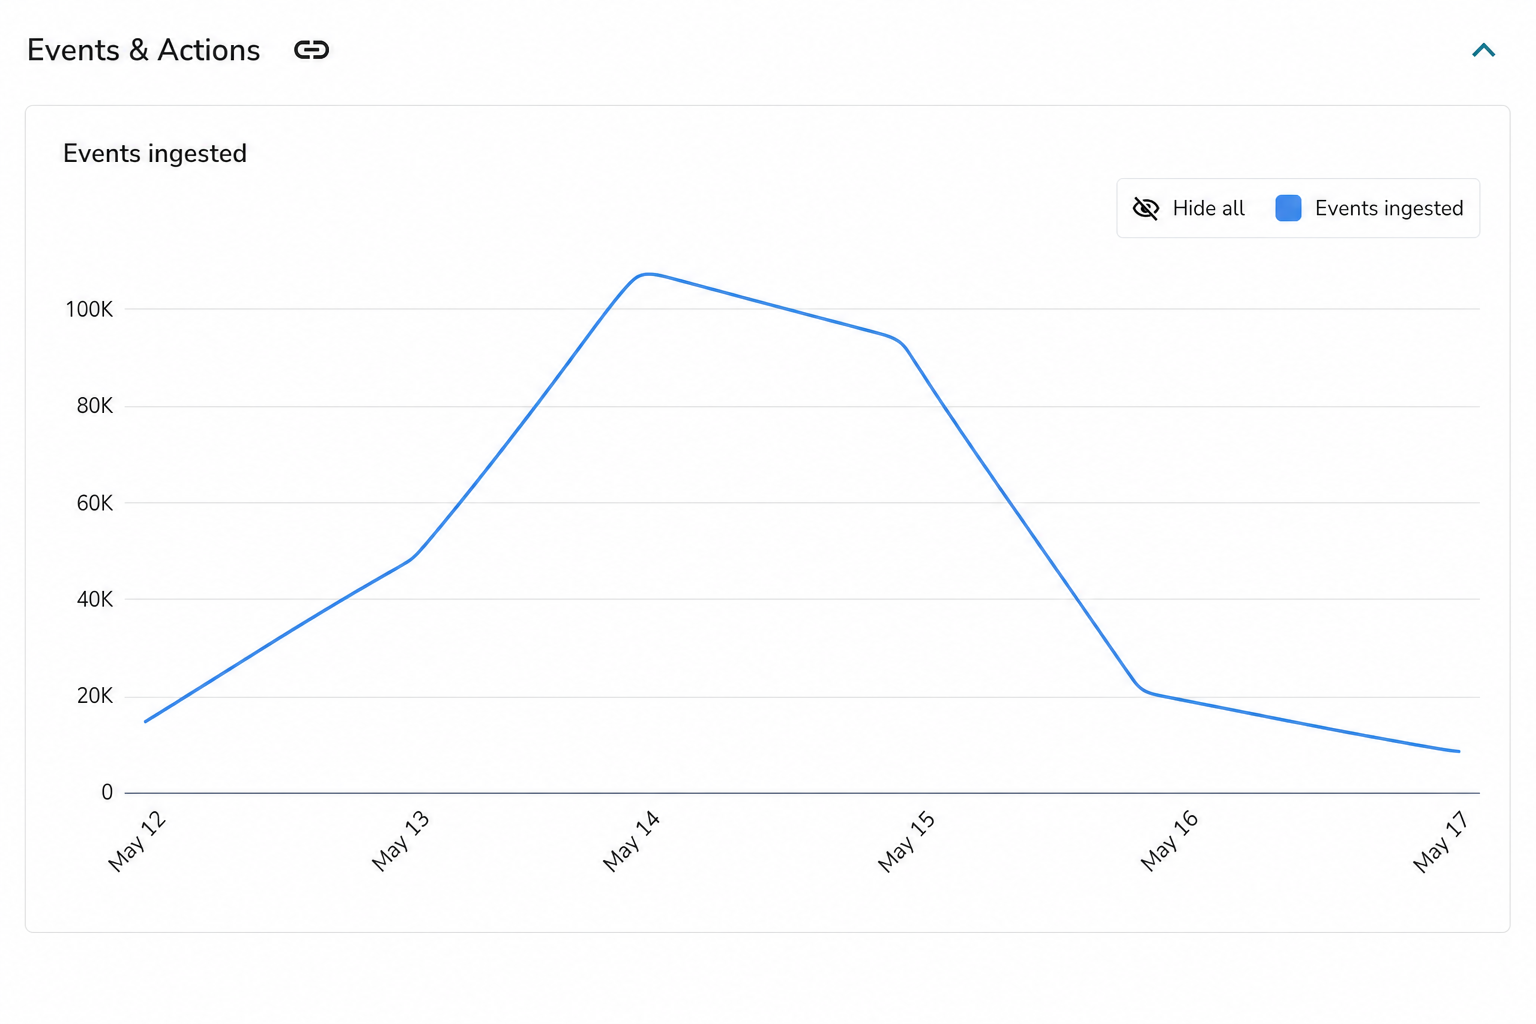
Events & Actions
Shows the total number of Events ingested over the selected time range.
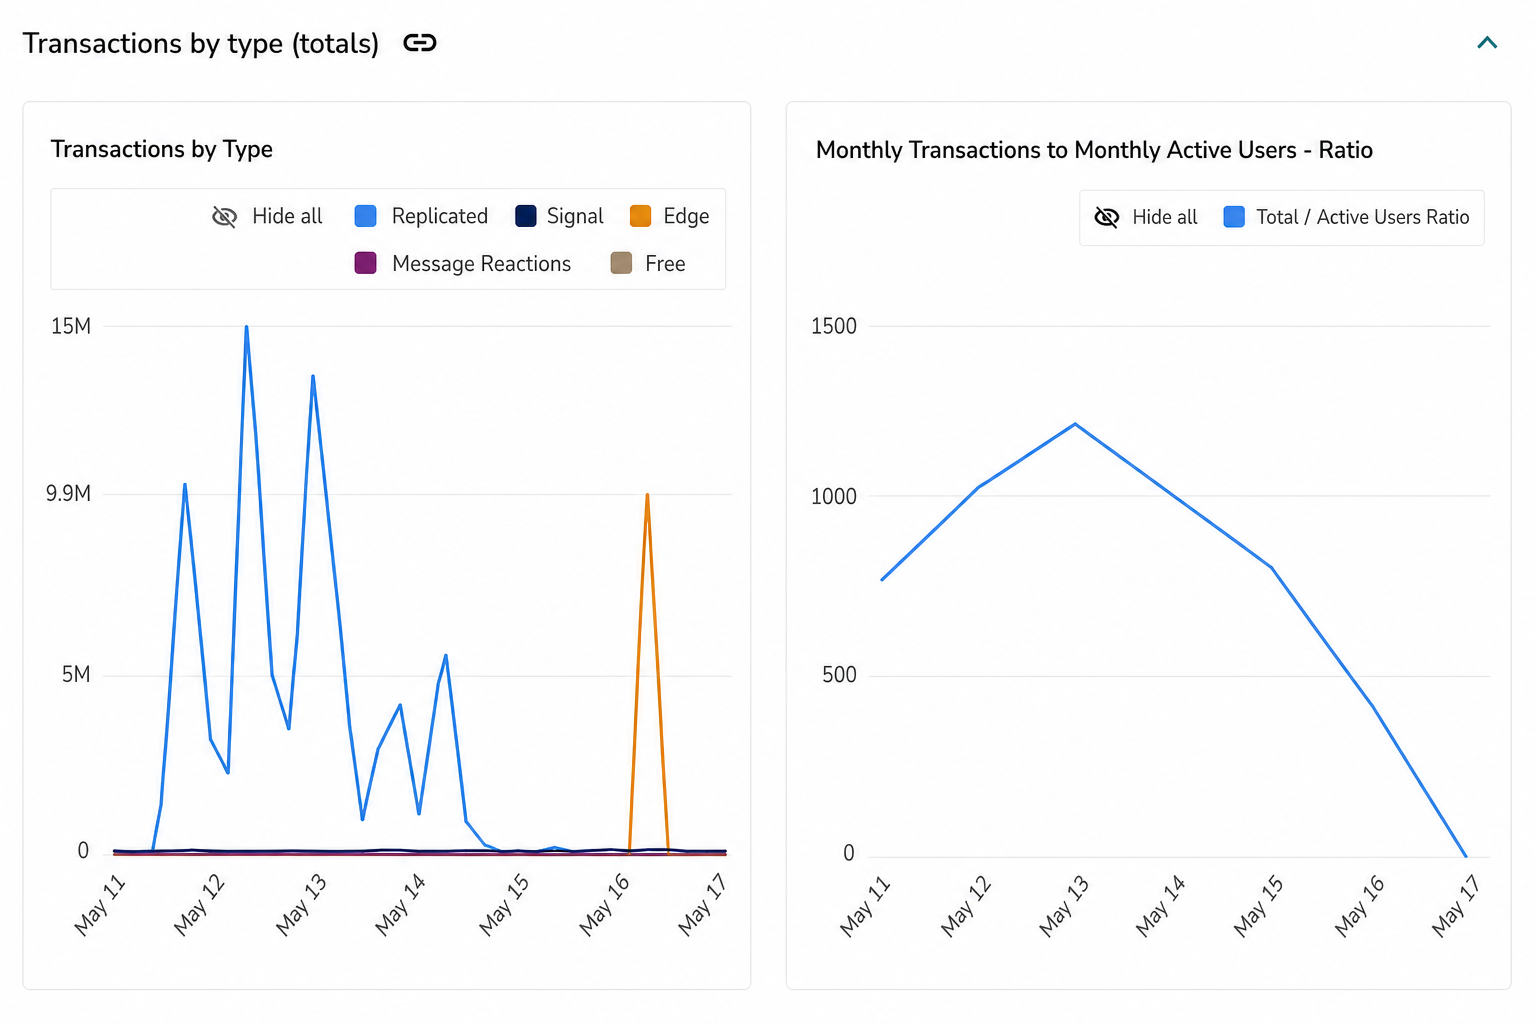
Transactions by type (totals)
Shows the total number of Transactions by type over the selected time range.
Each transaction type represents a different kind of request:
| Type | Description |
|---|---|
| Replicated | Any request that sends data into PubNub and needs to be replicated across all global network nodes — for example, publish, grant, and adding channels to a channel group. |
| Edge | Any request that retrieves data from PubNub (data already replicated to edge nodes) — for example, subscribe, history (fetchMessages), and HereNow. |
| Signal | Lightweight, lower-cost publishes intended for transient data such as typing indicators or GPS location updates. Only the most recent value is retained — earlier signals not received by subscribers are discarded. |
| Message Reactions | Add, edit, or remove message actions — used for emoji reactions, read receipts, soft deletes, or custom annotations. Message Reactions have their own transaction type and a lower price than standard publishes. |
| Free | Includes time and fire transactions. |
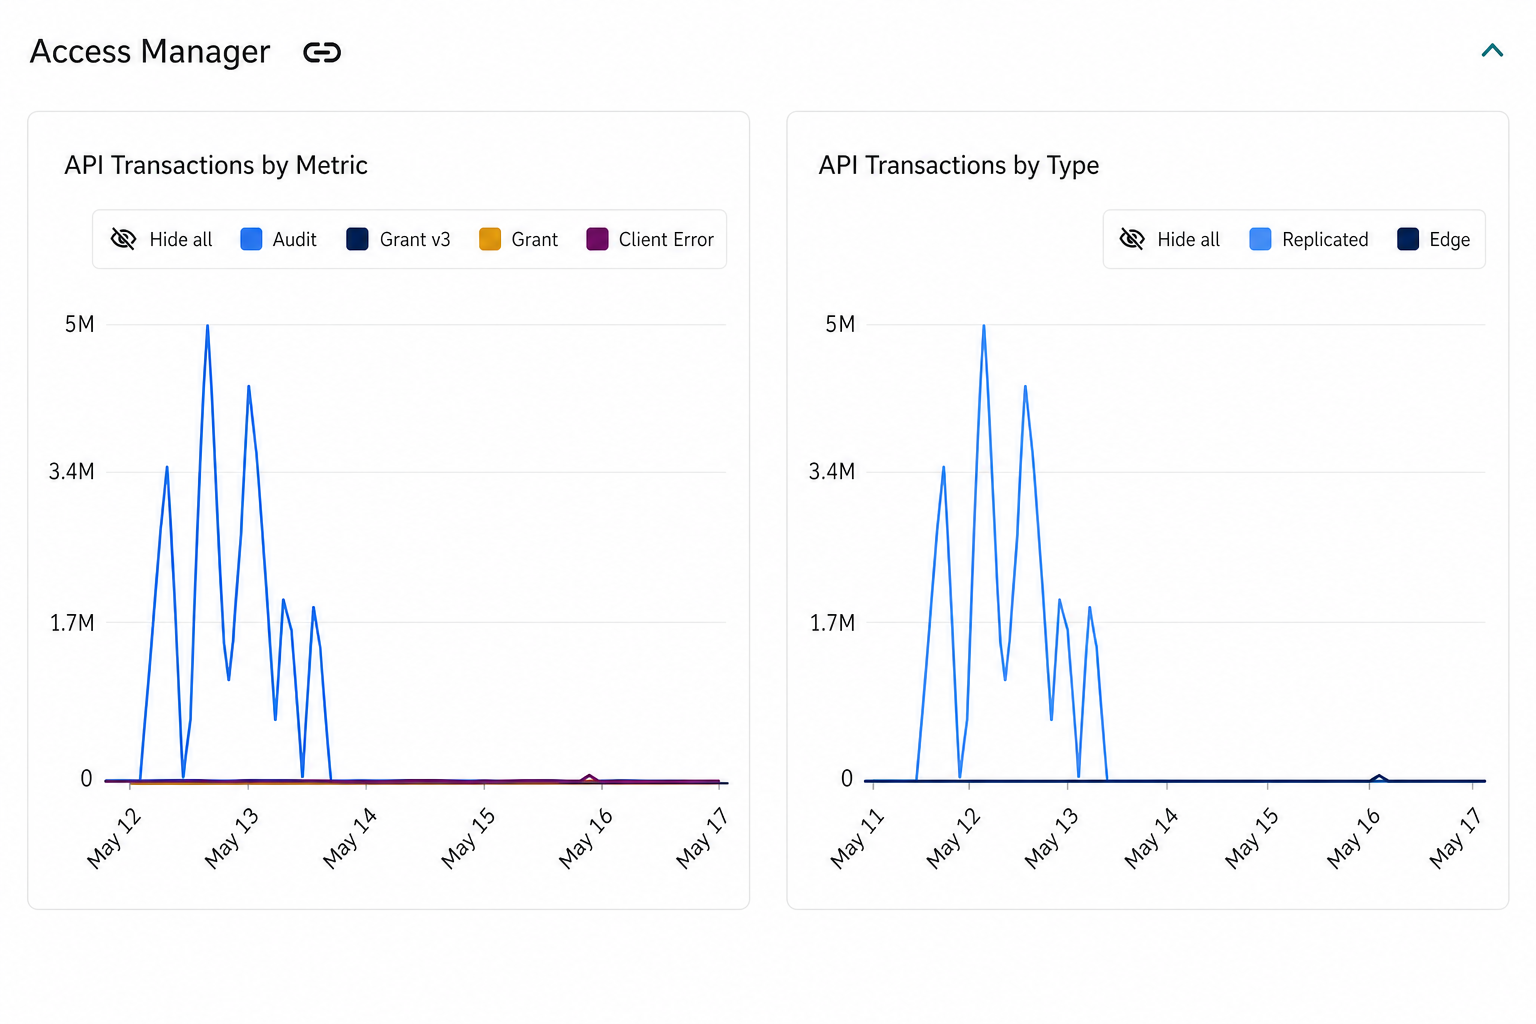
Access Manager
Shows the total number of Transactions for the Access Manager API over the selected time range.
The chart breaks down Access Manager activity into the following metrics:
- Grant (v2) — Requests to the Access Manager v2 grant API, which store and replicate permissions across PubNub's network. These are counted as replicated transactions.
- Grant v3 — Requests to the
grantTokenAPI, which asks PubNub to create and sign an auth token and return it to the caller. These are also counted as replicated transactions. - Client Error — Grant requests that failed for any reason.
- Audit — Based on a legacy Access Manager v2 API that has been end-of-lifed. Transactions are recorded but no meaningful data is returned.
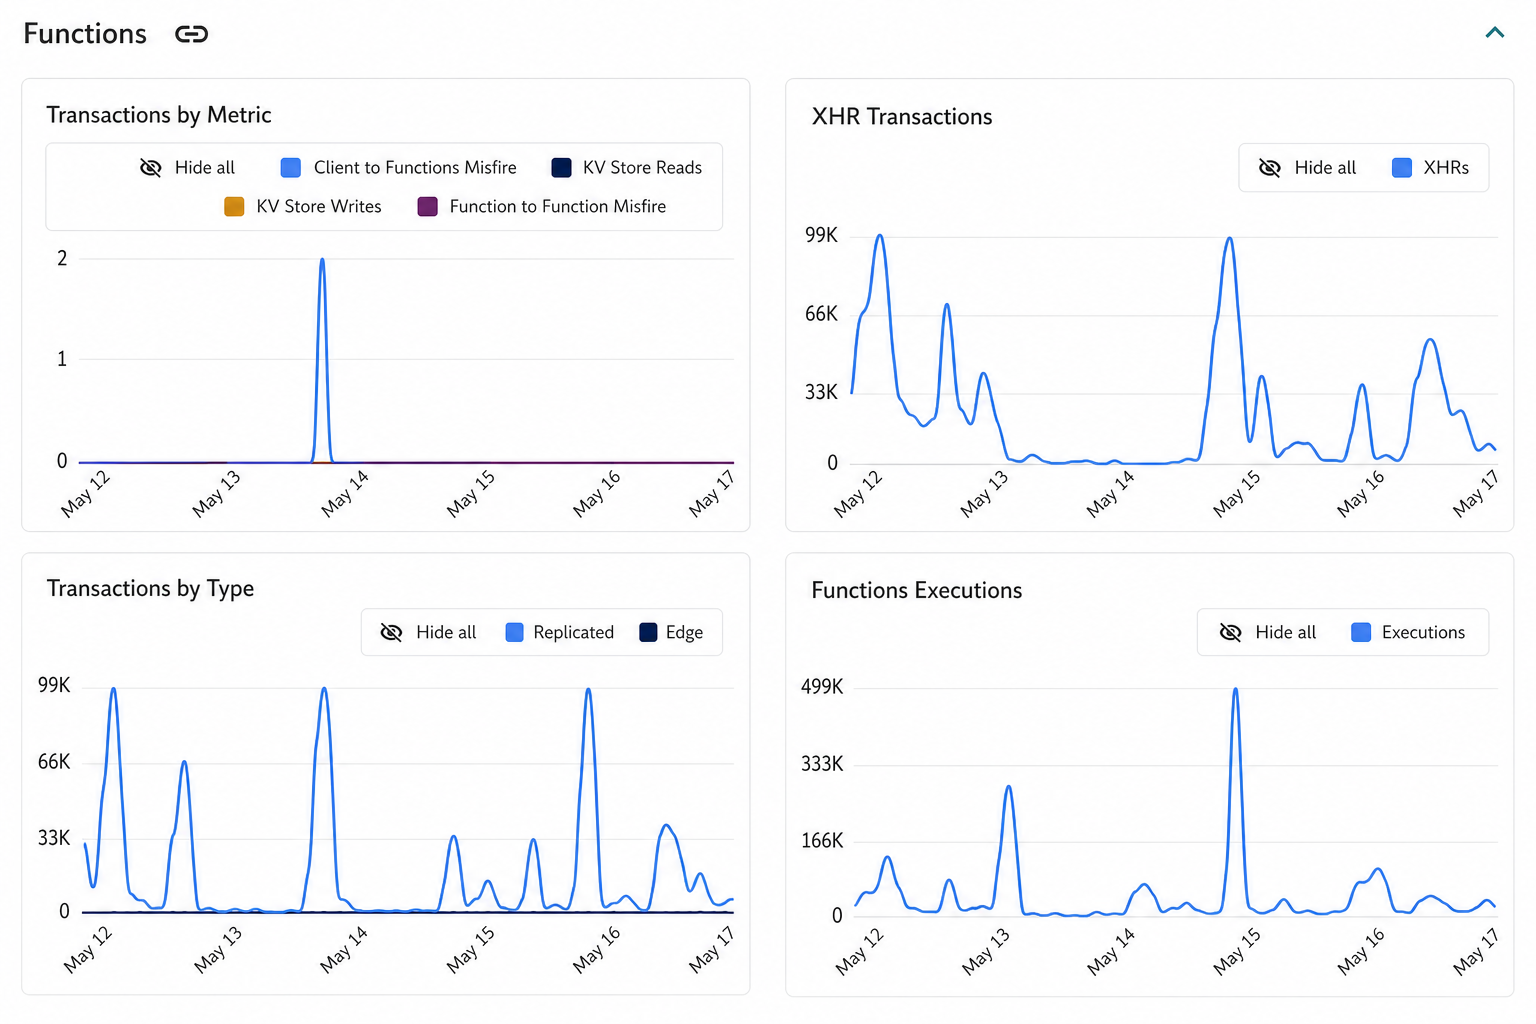
Functions
Shows the total number of Transactions for the Functions API over the selected time range.
The chart breaks down Functions activity into the following metrics:
- Executions — The total number of times a Function ran.
- KV Store Reads — Read operations against the KV Store, the built-in persistent key-value database available to all Functions on a keyset.
- KV Store Writes — Write operations against the KV Store.
- XHR Transactions — Outbound HTTP/HTTPS requests made by Functions using the XHR module to call external APIs or webhooks.
- Client to Functions Misfire — A client event (such as a publish) triggered a Function, but the Function did not execute — typically because the incoming request rate exceeded the Function's processing capacity.
- Function to Function Misfire — A Function attempted to invoke another Function (via
pubnub.publish()orpubnub.fire()), but the chained Function did not execute.
The Transactions by Type view shows Functions transactions as Replicated or Edge, based on the type of triggering event.
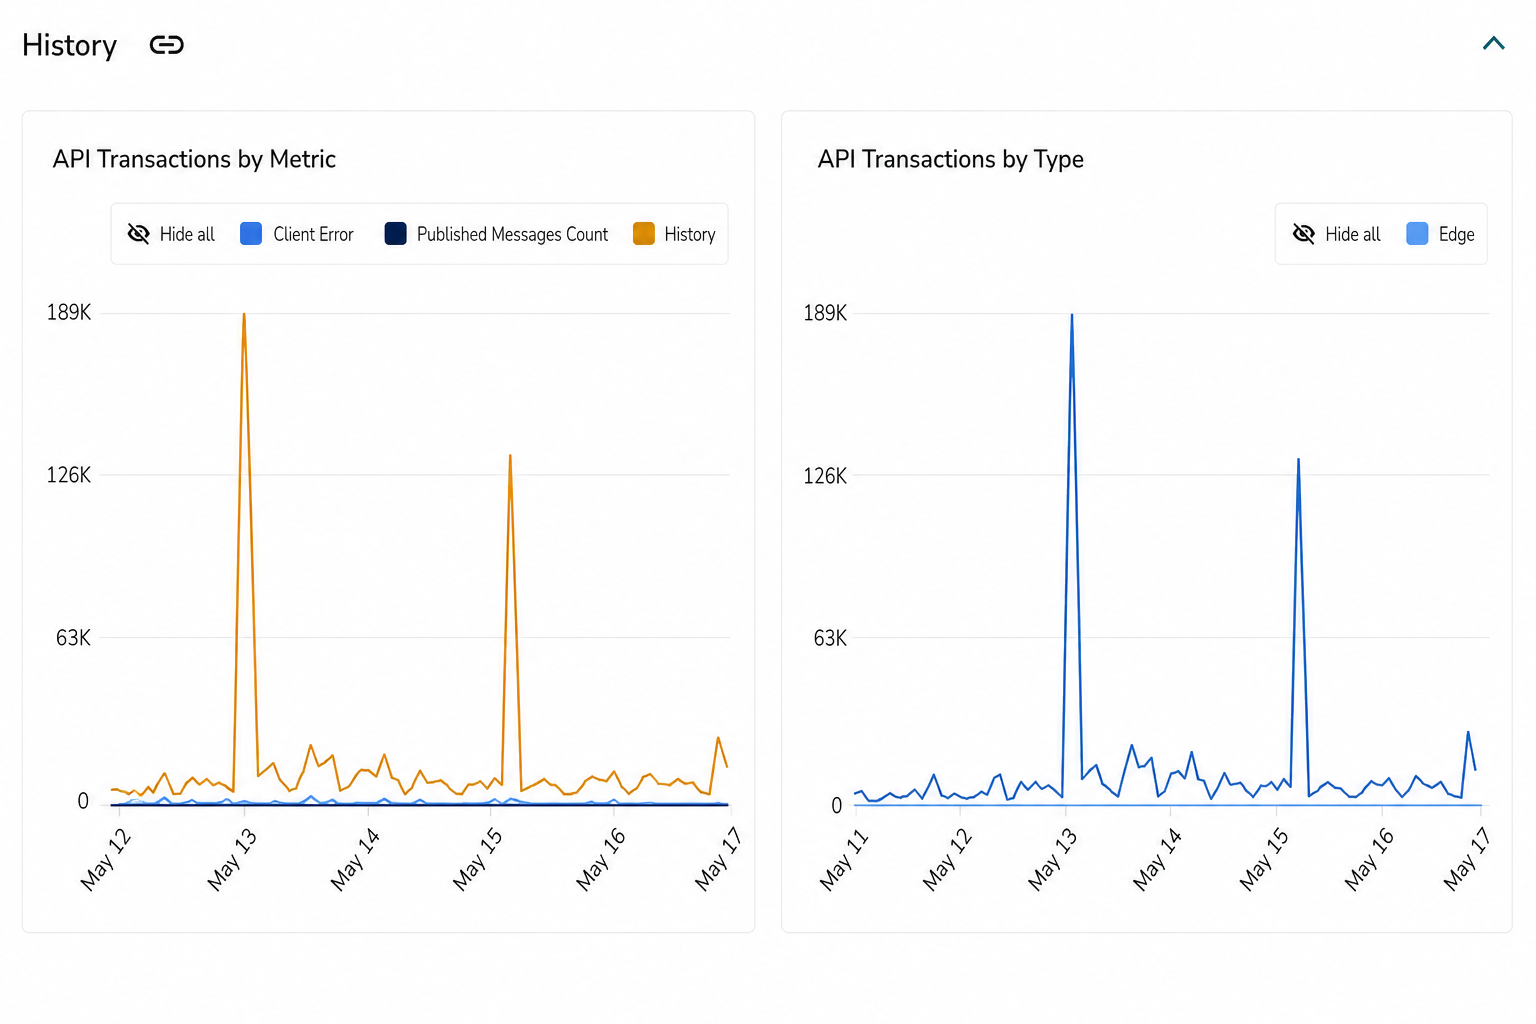
Message Persistence
Shows the total number of Transactions for the History API over the selected time range.
The chart breaks down History API activity into the following metrics:
- History — Requests made by the
fetchMessagesAPI to retrieve persisted (previously published) messages. - Published Messages Count — Requests made by the
messageCountsAPI, which returns the number of messages published since a given timestamp. Common uses include unread message badges and checking for new messages before fetching message data. - Client Error — History API requests that failed for any reason.
The API Transactions by Type view shows all History transactions as Edge, since retrieving persisted messages is a read operation served from PubNub's edge nodes.
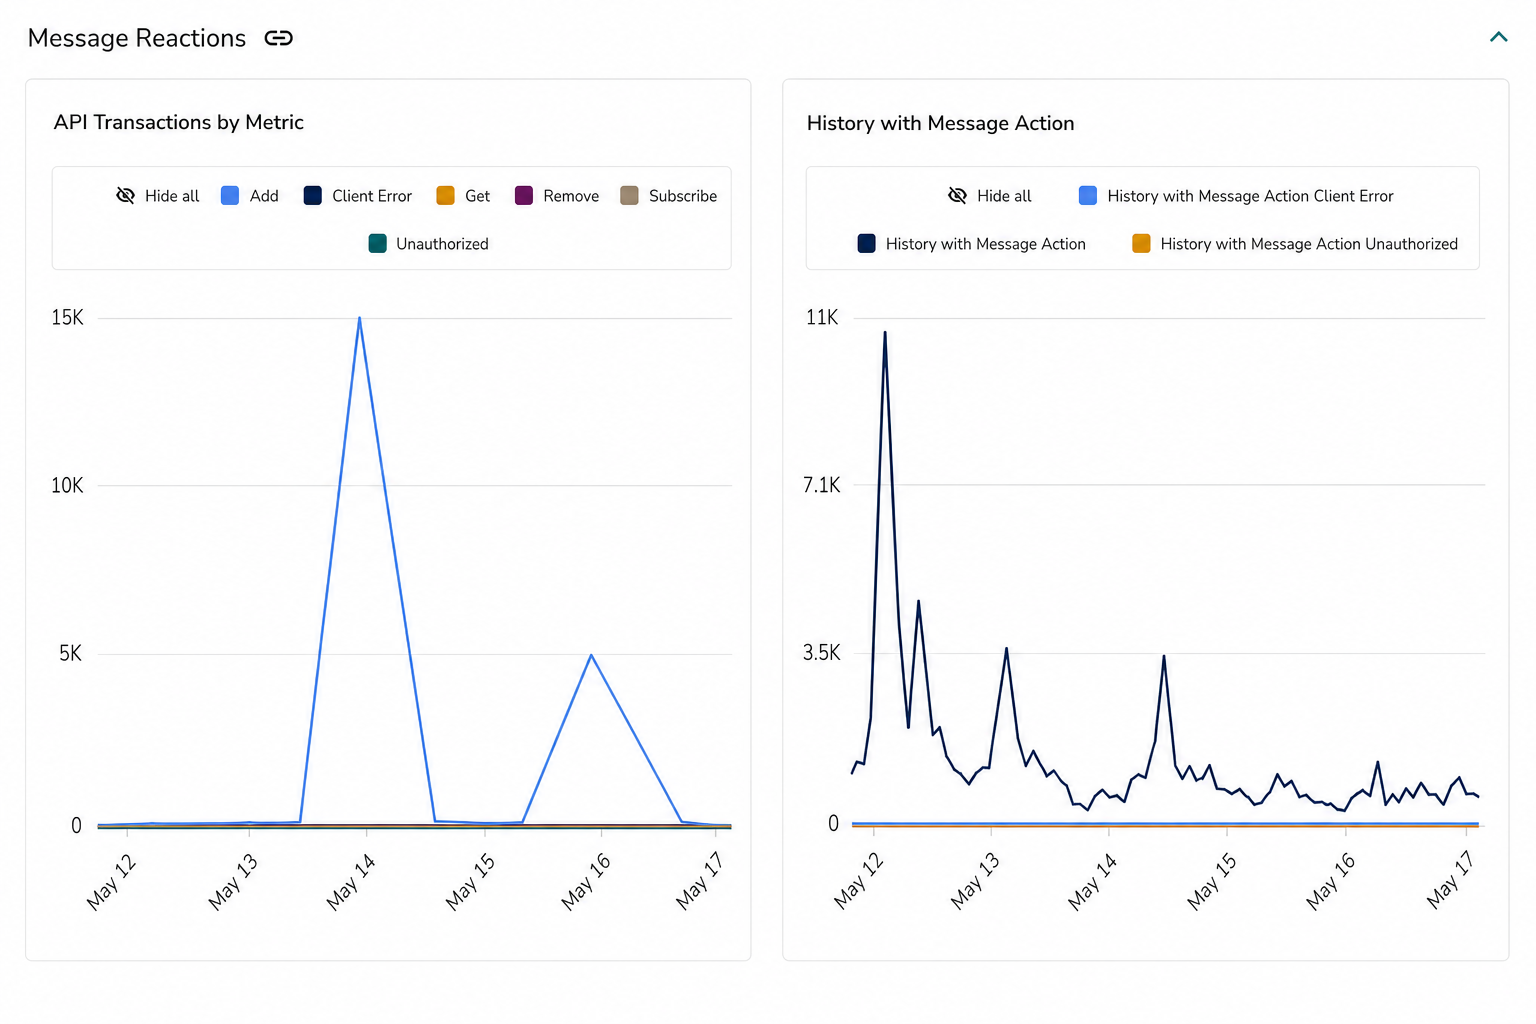
Message Reactions
Shows the total number of Transactions for the Message Reactions API over the selected time range.
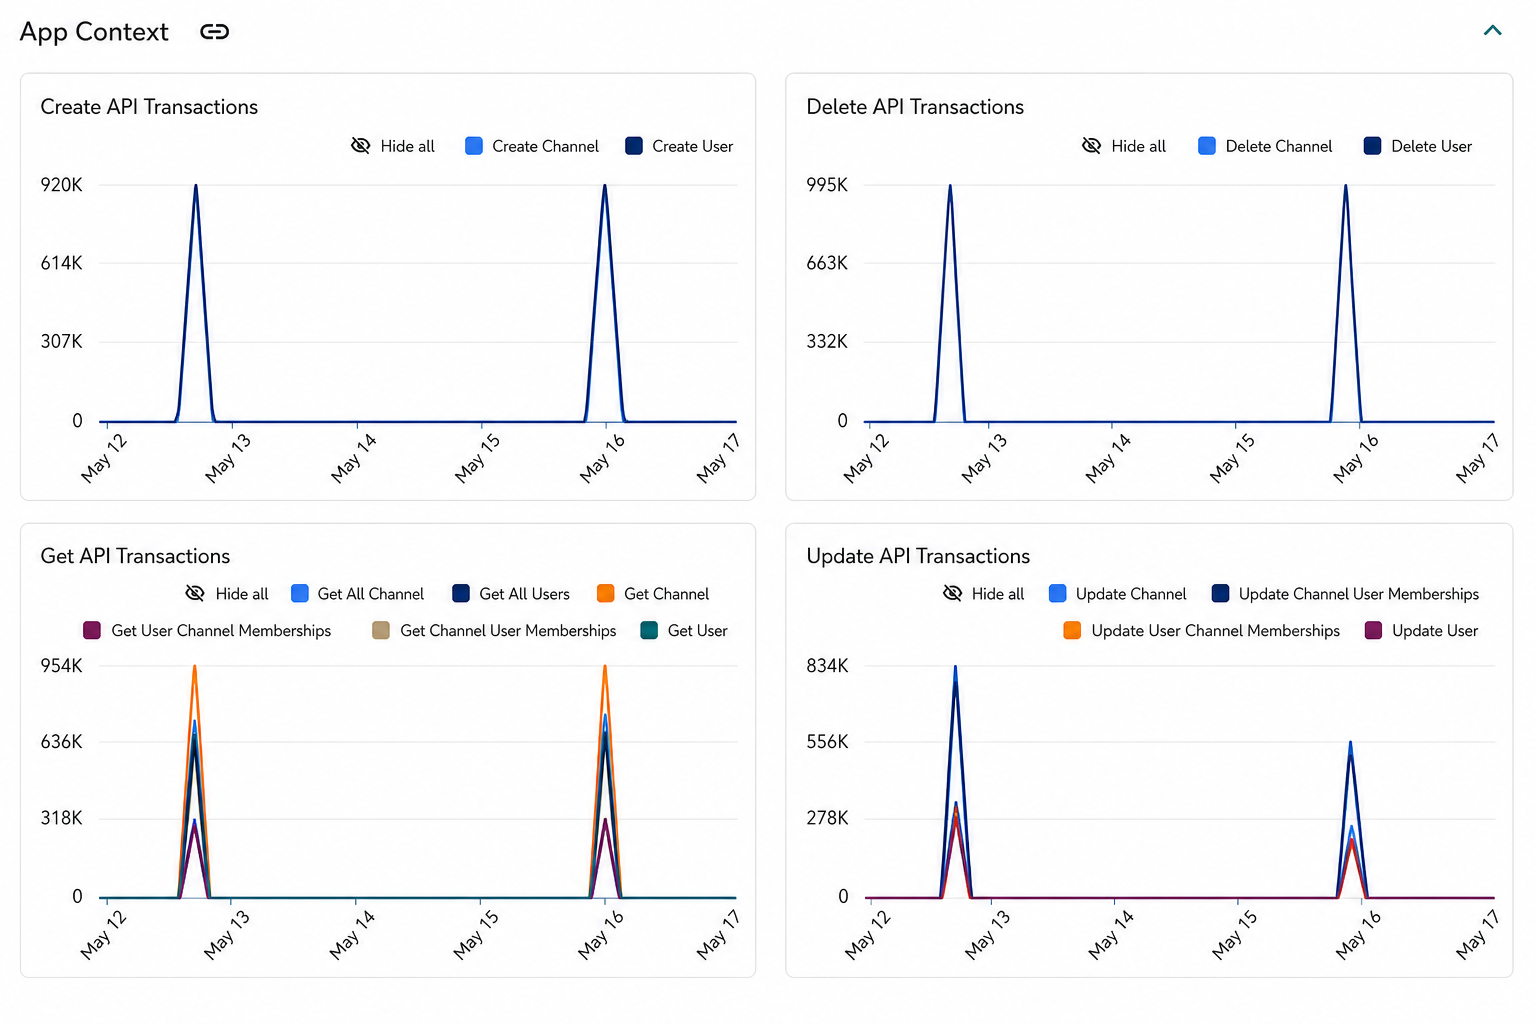
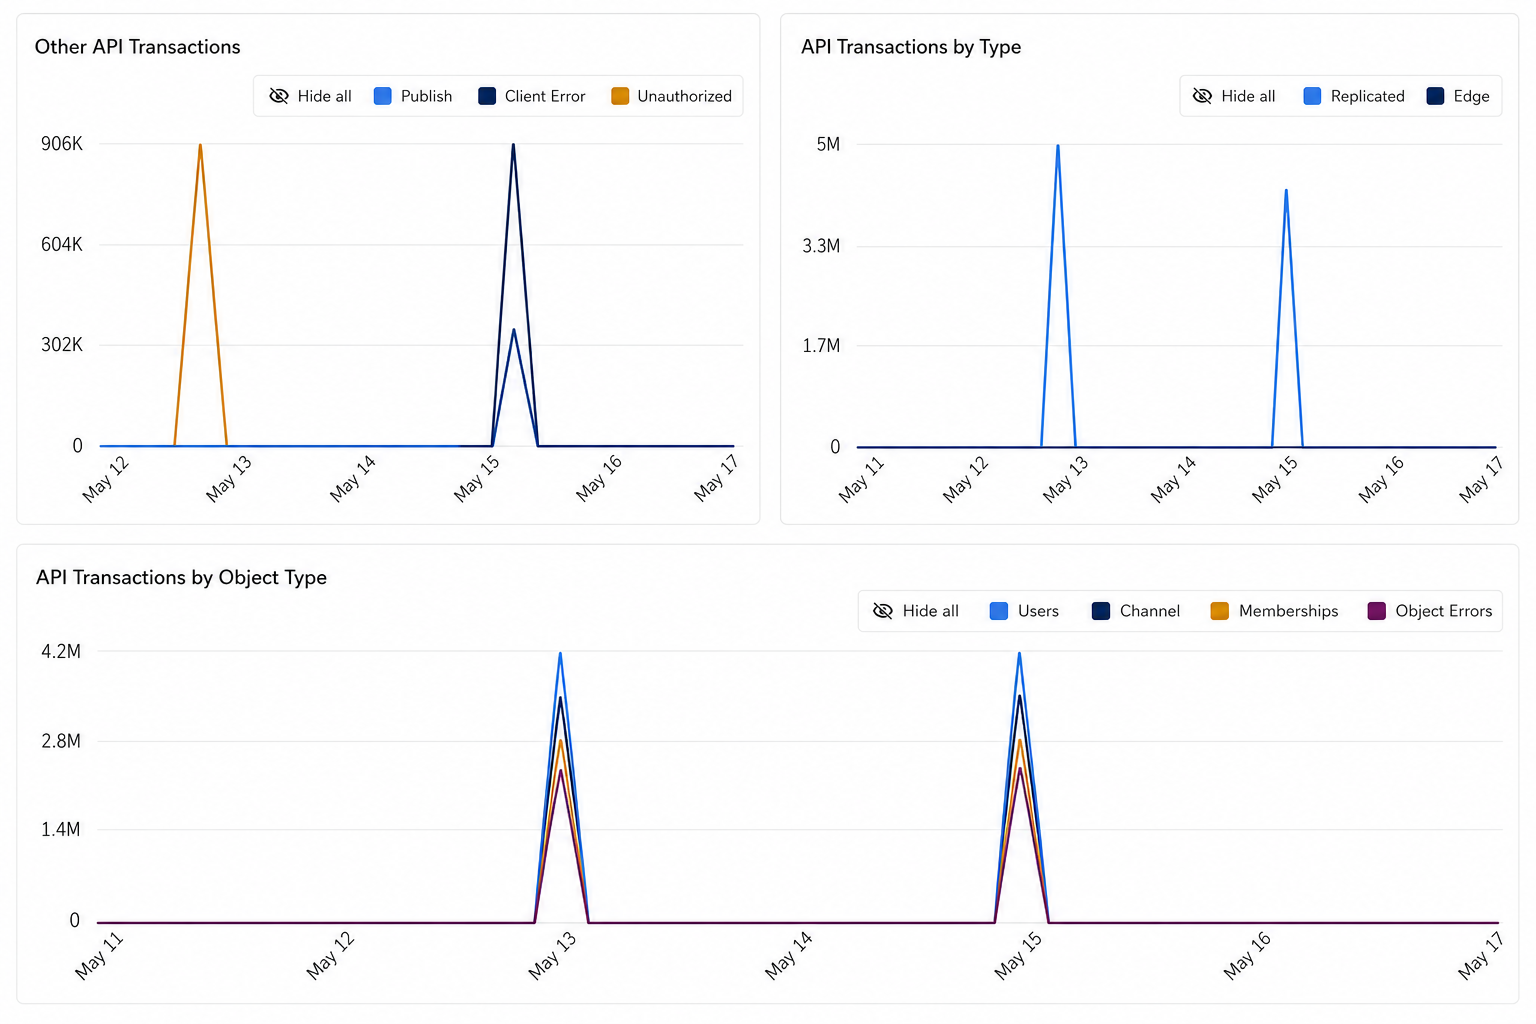
App Context
Shows the total number of Transactions for the App Context API over the selected time range.
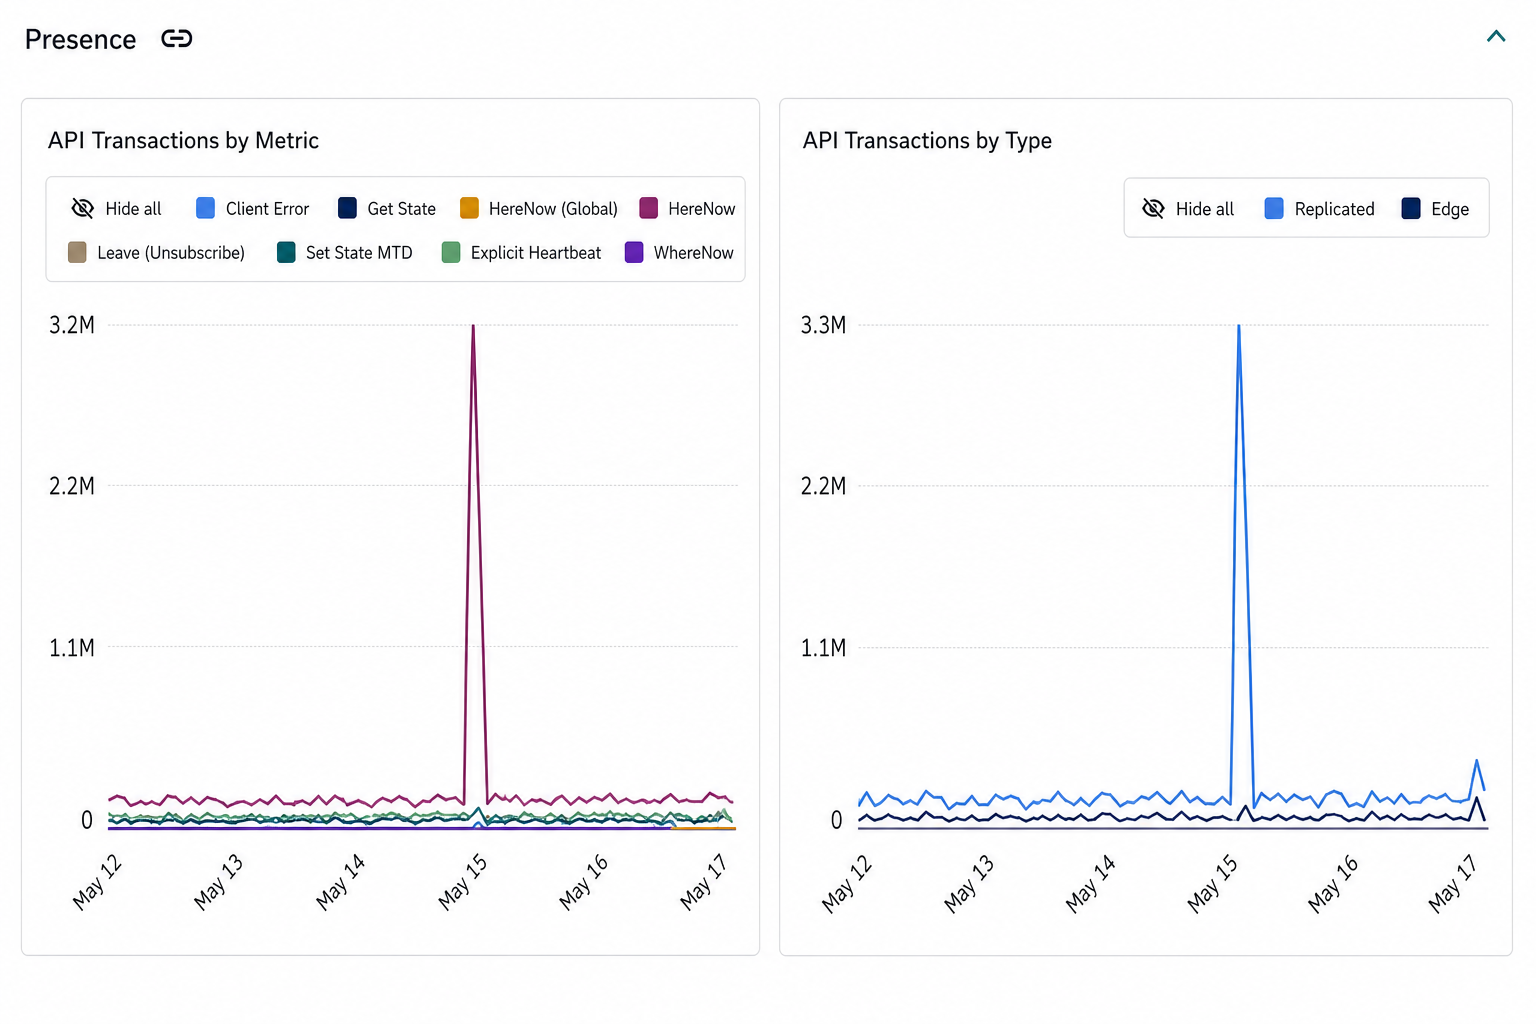
Presence
Shows the total number of Transactions for the Presence API over the selected time range.
The chart includes the following metrics:
- Explicit heartbeats are counted. Implicit heartbeats — where the subscribe long poll connection expires naturally (after 280 seconds without a message) and the SDK automatically reconnects — are not counted here, because they are not Presence API calls.
- Leave (unsubscribe) transactions are client leave requests, not Presence Leave Events. When a client calls unsubscribe, the SDK cancels the current subscribe request and immediately sends an individual leave request for each unsubscribed channel directly to the Presence system. This triggers a Presence leave event to be published by PubNub. Leave requests are sent regardless of whether Presence is enabled on the keyset, because the SDK has no knowledge of keyset configuration.
- Published Presence events (the events PubNub publishes to
-pnpreschannels as a result of Presence activity) are not included in this chart. Those are Publish API transactions and appear in the Publish chart instead.
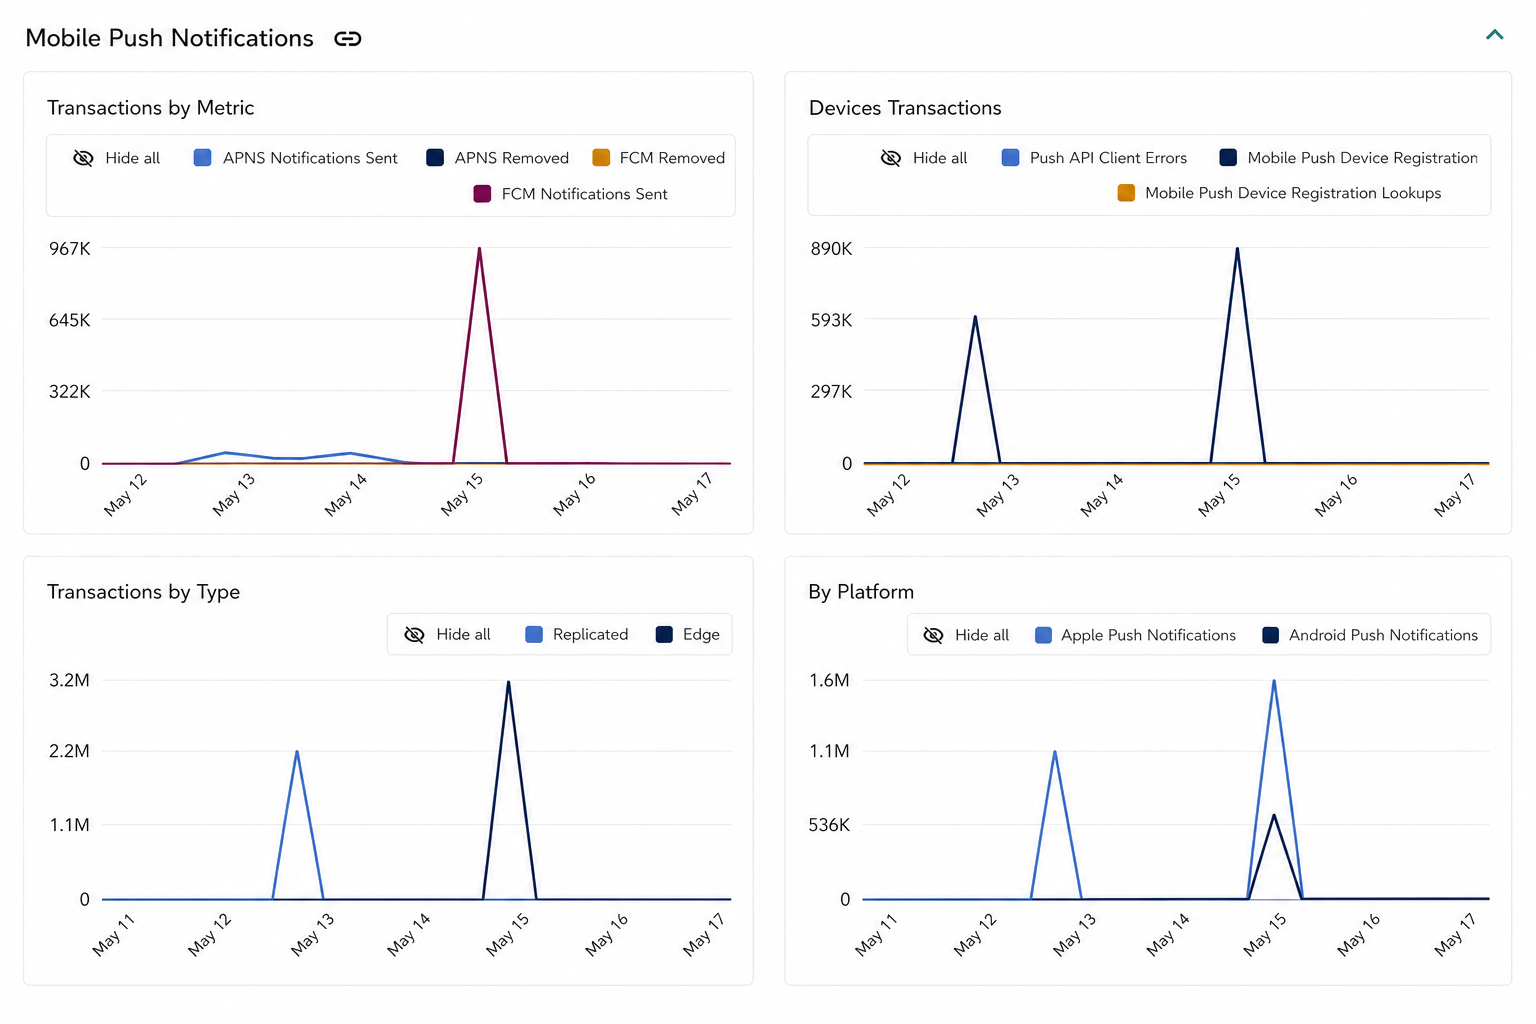
Mobile Push Notifications
Shows the total number of Transactions for the Push Notifications API over the selected time range.
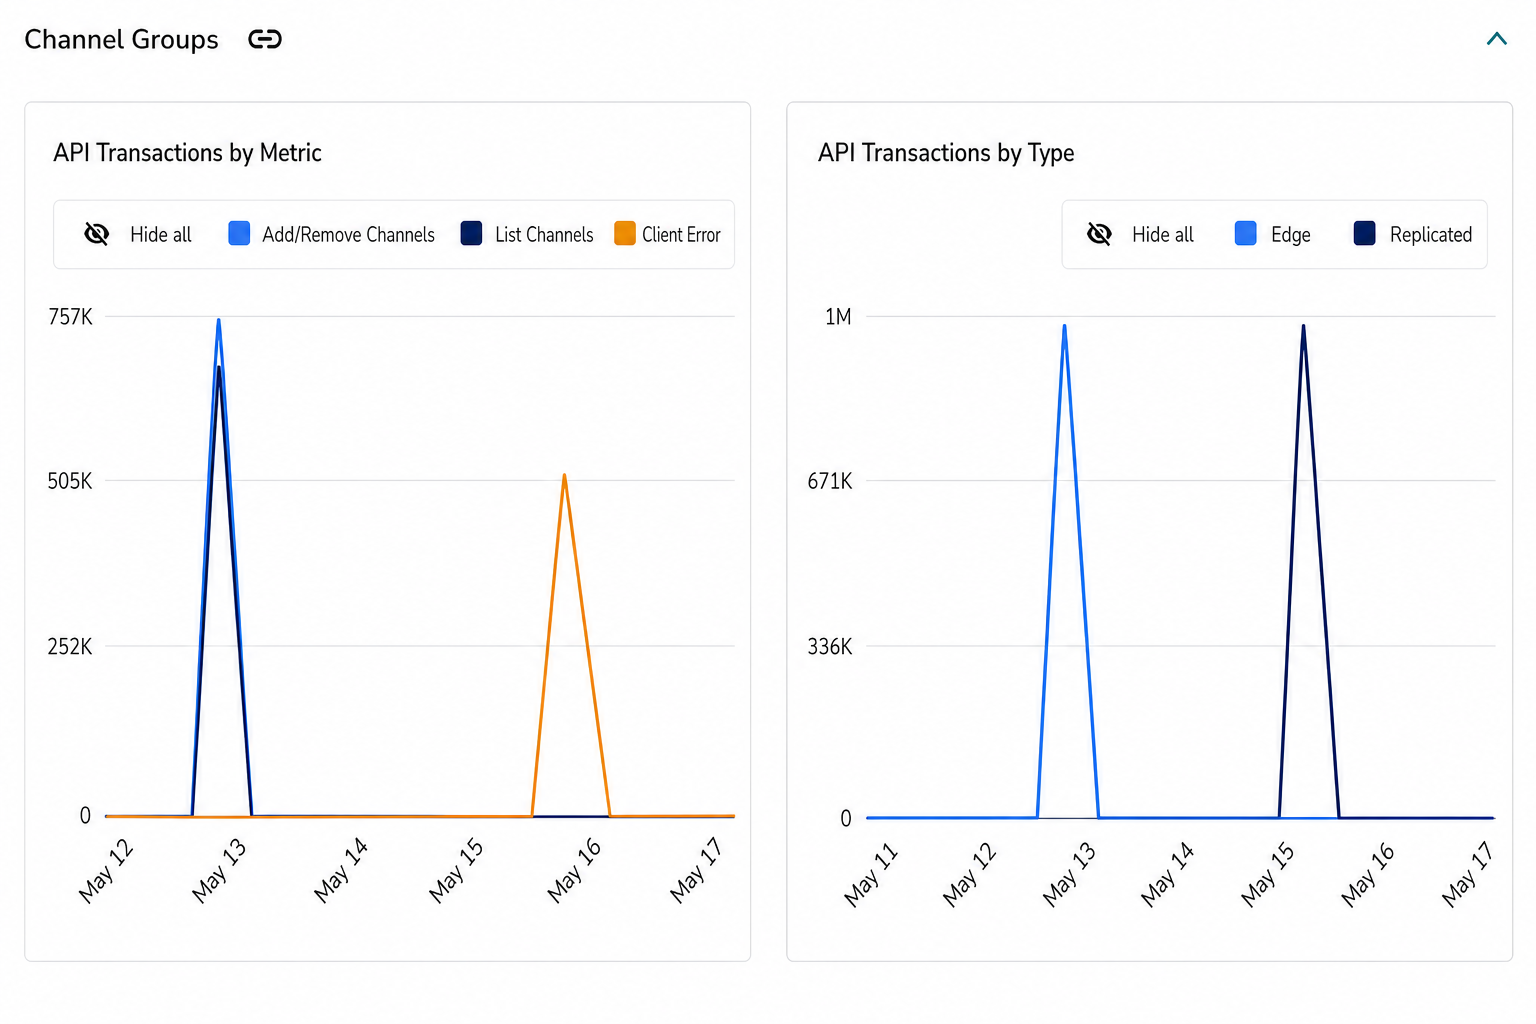
Channel groups
Shows the total number of Transactions for the Channel Groups API over the selected time range.
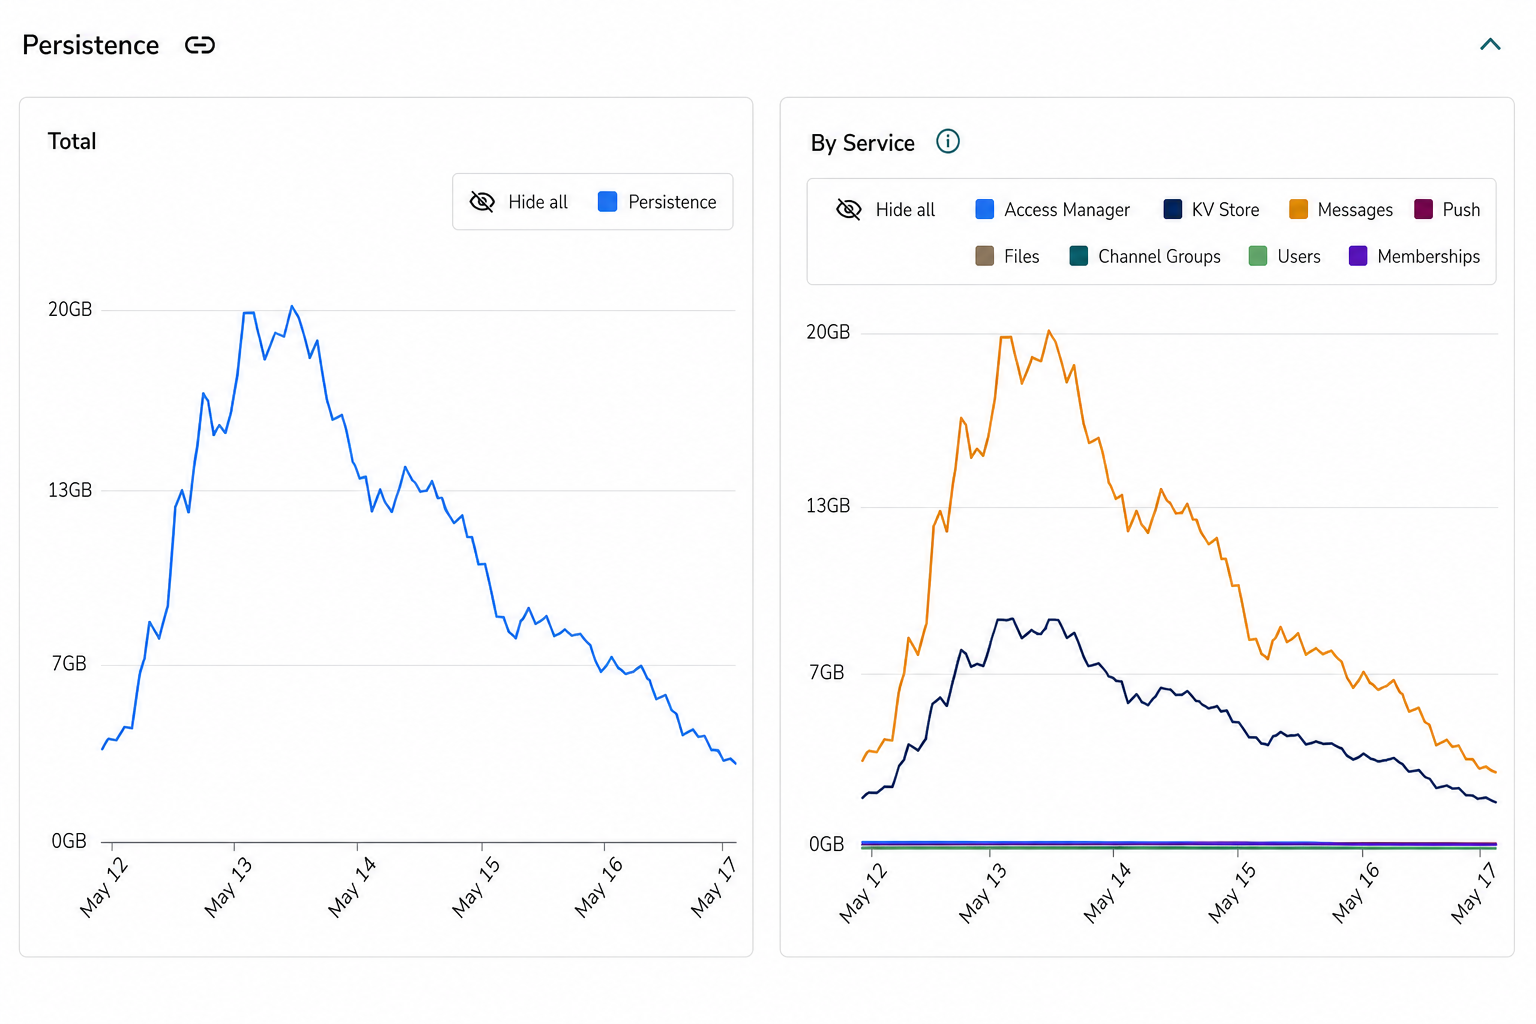
Persistence
Shows the total number of Transactions for the Persistence API over the selected time range.
The By Service breakdown shows storage usage split by service type. Services included are:
- Messages
- Channel group registrations
- Access Manager (v2 and v3 revoke storage)
- Files
- App Context
- Mobile push registrations
Usage metrics and deletions
Metrics for past dates reflect activity at the time it occurred and are not updated by deletions. Changes to stored data volume appear within 24 hours.
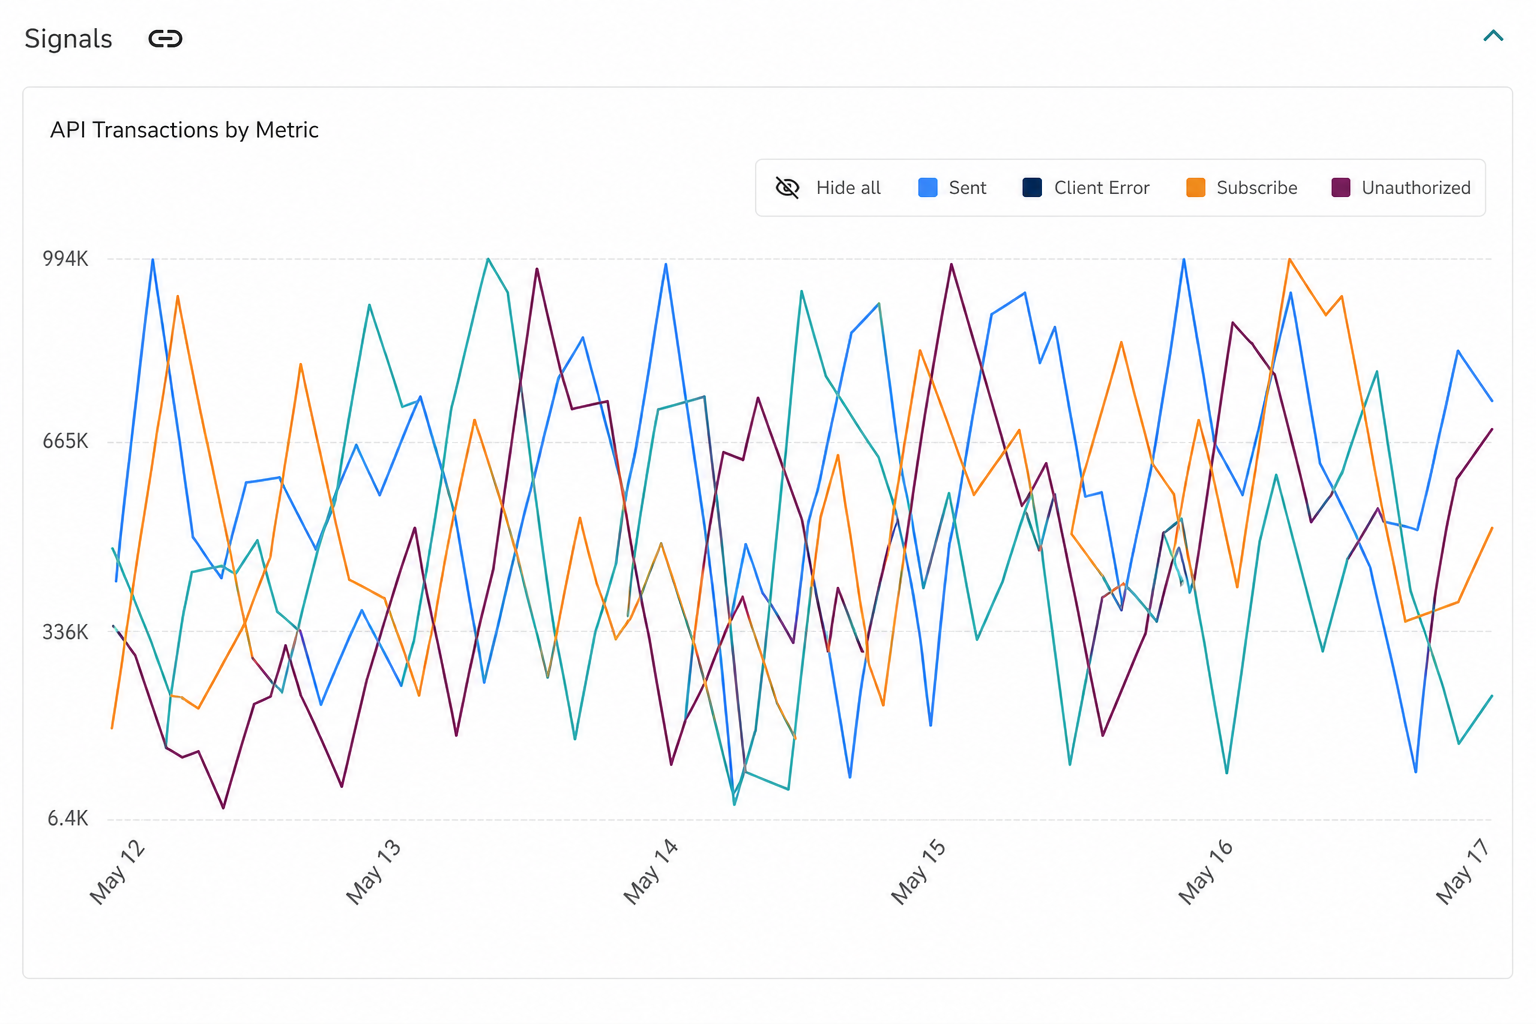
Signals
Shows the total number of Signals in the Publish/Subscribe API over the selected time range.
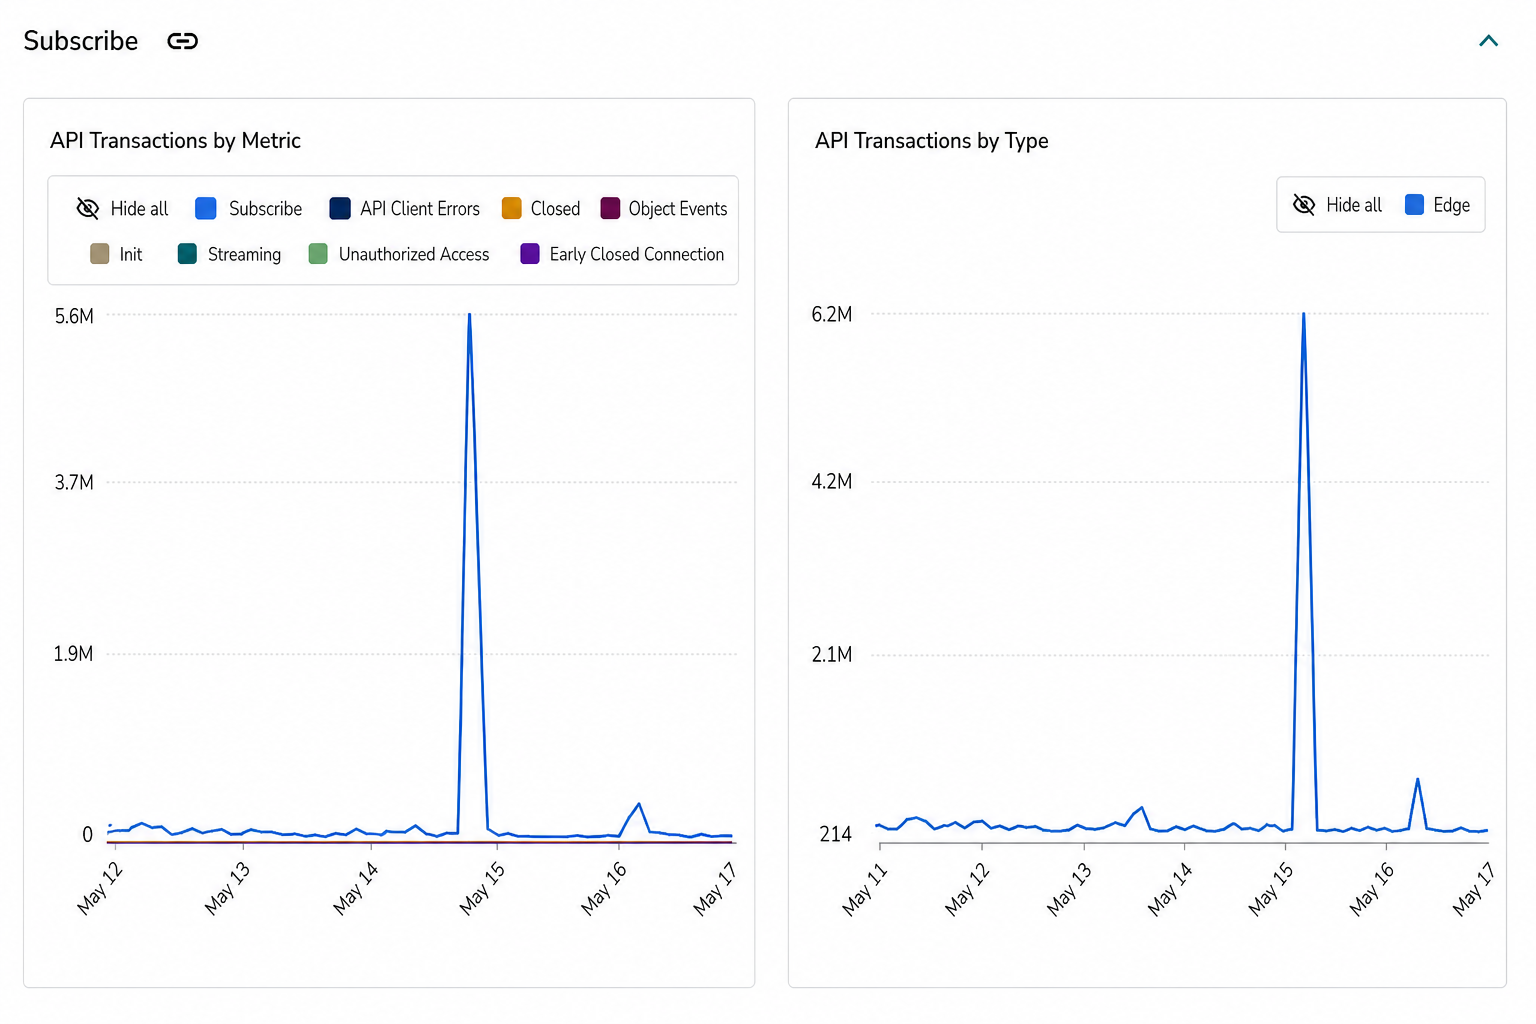
Subscribe
Shows the total number of Transactions for the Publish/Subscribe API over the selected time range.
The chart includes the following metrics:
- Subscribe — Transactions where a message was received by the subscriber.
- Closed — The subscribe long poll reached the end of its timeout period (280 seconds) without a message being received. PubNub responds with an empty payload and the client SDK automatically starts a new long poll to keep the client subscribed.
- Init — The very first subscribe request that opens a subscribe long poll session. Unlike subsequent requests, it does not include a subscribe timetoken parameter.
- Early Closed Connection — The client dropped the connection before PubNub could respond to the subscribe request. This is logged as an HTTP 499 status on the server side; the client does not receive a status code because the connection was already closed.
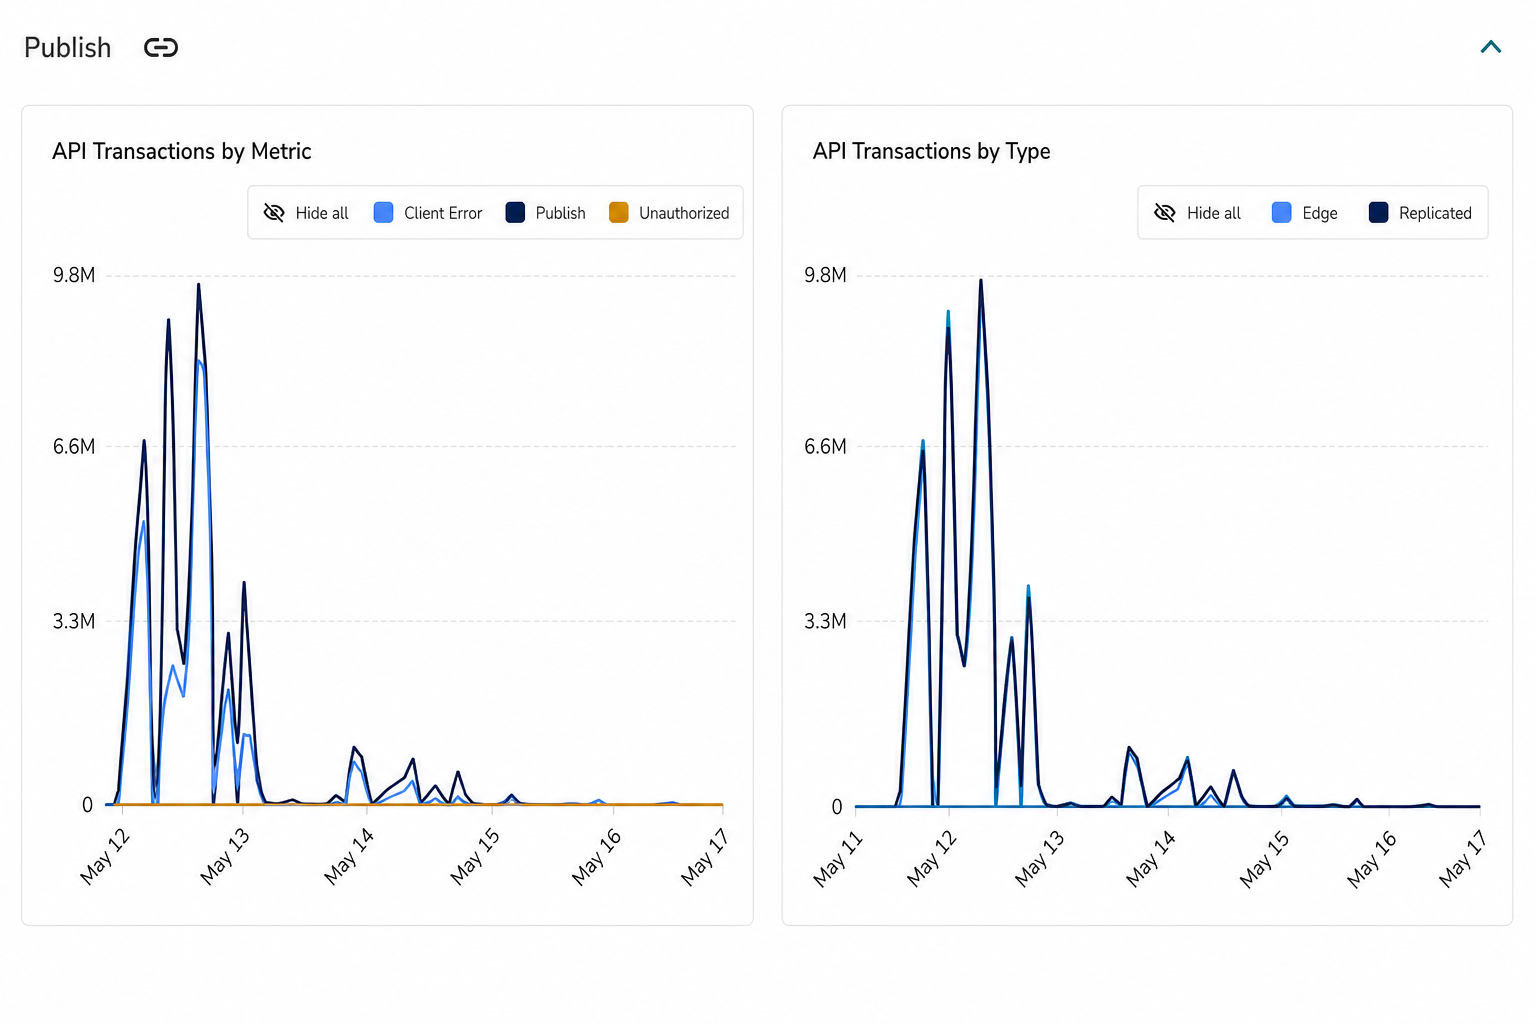
Publish
Shows the total number of Transactions for the Publish/Subscribe API over the selected time range.
The count includes both messages explicitly published by client and server applications, and events generated by PubNub services — such as Presence events published to -pnpres channels and App Context update events.
Comparing publish and subscribe transaction volumes shows the fan-out ratio: how many messages are received per message published across all channels.
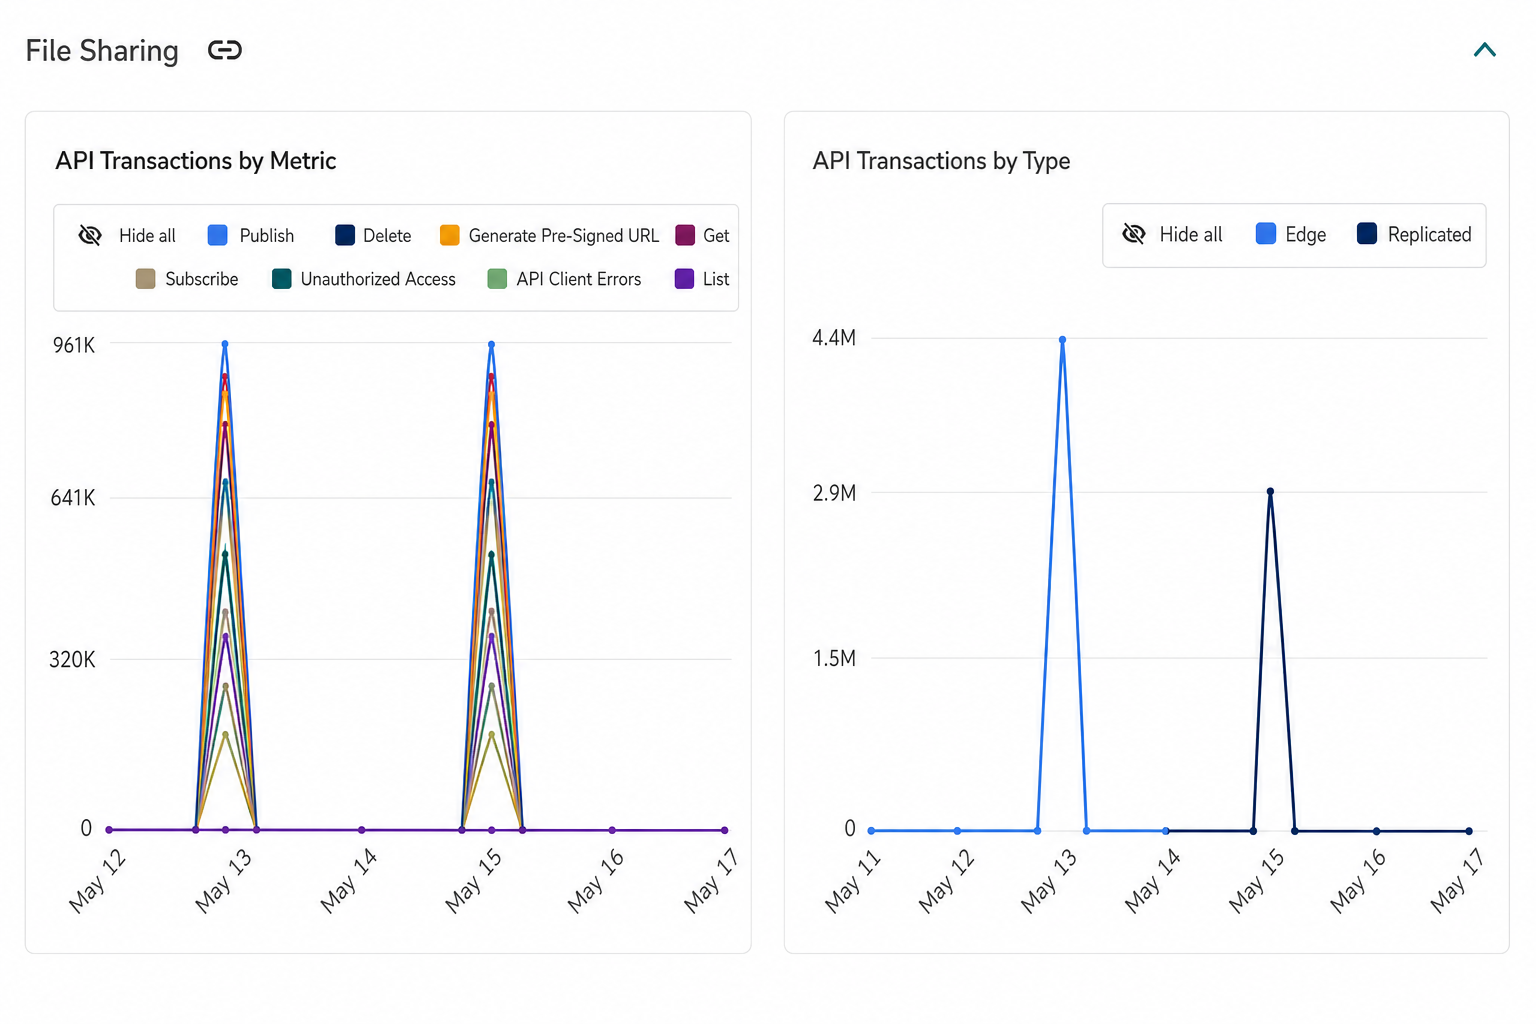
File sharing
Shows the total number of Transactions for the File Sharing API over the selected time range.